Japan
Wood Products Prices
Dollar Exchange Rates of 25th
October 2016
Japan Yen 104.23
Reports From Japan
IMF - 2% inflation target not achievable in
the medium
term
During the most recent meeting of the IMF and the
Institute of International Finance forecasts for the Japanese
economy were revised up. The Japanese economy is
expected to grow by 0.6% this year and in 2017. For 2017
the IMF forecast represents a major upgrade as the
organisation had expected growth to fall.
The annual meetings of the International Monetary Fund
and the Institute of International Finance are major global
financial and economic sector conferences drawing
participants from finance, politics and economics
including finance ministers and central bankers.
The IMF is now certain that the 2% inflation target that
had driven policy decisions by the Bank of Japan will not
be achievable in the medium term.
BoJ to consolidate more orthodox approach to fiscal
policy
Consumer prices in Japan continue unchanged which, say
analysts, strongly suggests the slowdown in inflation in the
country is more to do with weakness in the domestic
economy rather than falling commodity prices. If this is
the case then the 2% inflation target which had driven the
Bank of Japan’s (BoJ) policy until recently is unattainable
in the near future.
The consensus is that the BoJ, which has a two day policy
meeting in the first week on November, will consolidate
its new and more orthodox approach to fiscal policy and
will not announce any surprise moves.
In recent statements from a BoJ spokesperson it appears
the Bank is expecting commodity prices to begin to rise
next year and that this and a more stable yen/dollar
exchange rate will help lift prices.
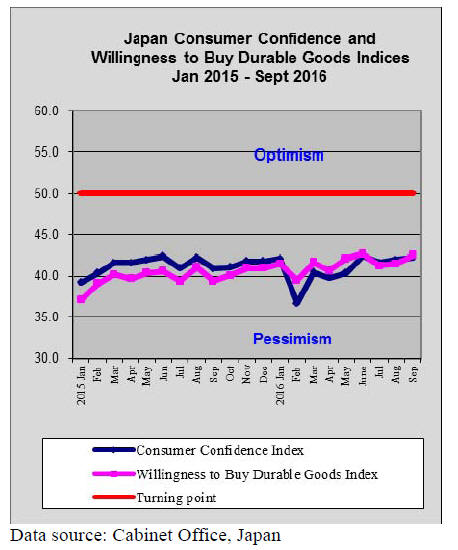
Household spending unmoved in September
September household spending data from the Ministry of
Internal Affairs confirmed what has been reported by
retailers, Japanese consumers are tightening their purse
strings and holding back on purchases of non-essential
items.
The weakening September figures for household
spending
cap the downward trend seen in the previous six months.
For more see:
http://www.stat.go.jp/english/data/sav/index.htm
Yen changes course – drops 2.5% in a month
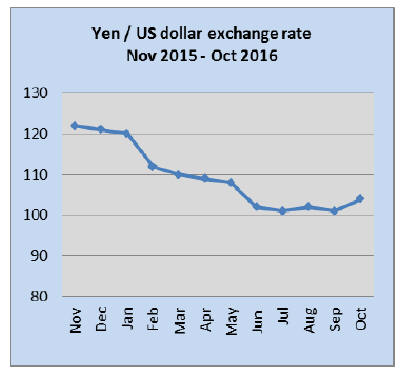
The yen has shifted direction once again and this time it is
weakening against the US dollar. In October the yen was
down 2.5% against the dollar, the steepest monthly drop
for several years.
The yen’s weakness is largely as the market is factoring in
an interest rate rise in the US in December. This and the
abrupt change of policy by the Bank of Japan, has meant
that money has been moved out of the yen.
BoJ has watchful eye on credit growth
While the BoJ does not yet use the term housing bubble it
has said it is closely watching the rising trend in housing
loans being offered by the commercial banks. This is
presumably a warning that the Bank will act if it sees
credit growth moving too fast.
The current concern on the part of the BoJ stems
from the
rapid change in the ratio of real estate investment to GDP
which they find is becoming disproportionate.
Counting the cost of the Kumamoto earthquake
The prefectural authorities in Kumamoto, the site of the
most recent devastating earthquake in Japan, have
estimated the damage at close to yen 4 trillion. Private
homes were particularly badly damaged with around
170,000 affected including some 8,000 that were
completely destroyed. A magnitude 6.5 earthquake struck
April 14, followed by a 7.3 magnitude quake two days
later.
The damage was not confined to homes as factories and
hotels were also damaged as were many roads and bridges.
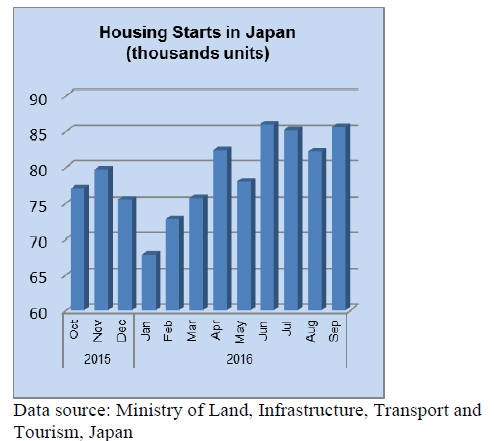
September 2016 housing starts were 13% up year on year
and a recovery in starts compared to August was achieved.
Import round up
Doors
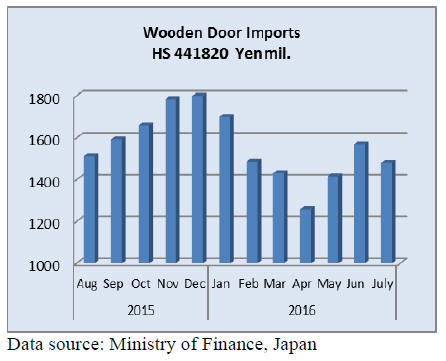
Year on year July 2016 wooden door imports were down
8.5%. The top three suppliers in July were, in order of
rank, China (64%), the Philippines (18%) and Malaysia
(6%). The three together accounted for over 80% of all
Japan’s wooden door imports in July.
Japan’s wooden door imports rose steadily in the second
half of 2015 to peak in December of that year.
Subsequently, imports fell for most of the first half of this
year and on the basis of the July import figures, the
continued rise in imports in June seems something of an
anomaly.
Windows
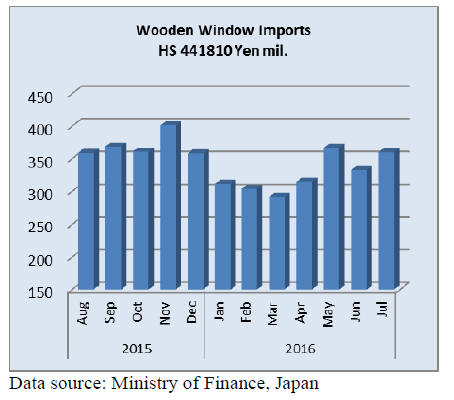
In contrast to the trends with wooden door imports a
different picture is presented in the data for wooden
window imports. Japan’s wooden window imports have
not exhibited the same volatility as seen with door
imports. Month on month wooden window imports rose
5% in July 2016 but year on year imports were down 17%
in July 2016.
Three suppliers account for the bulk of wooden window
supplies to Japan and each of the main suppliers has about
an equal share of the demand for imported windows:
China (34%), USA (29%) and the Philippines (26%).
Assembled flooring
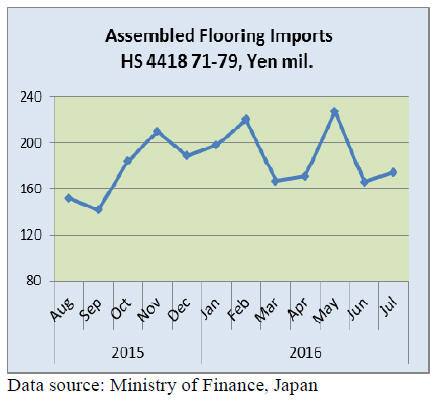
Three categories of assembled flooring are included in the data
presented below, HS 441871, 72 and 79. In July this year there
were no imports of HS 441871. For HS 441872 China, Malaysia
and Thailand were the main suppliers while for HS 441879 the
top ranked suppliers were Indonesia, China and Thailand.
Year on year Japan’s July imports of assembled flooring were
down almost 17% but month on month imports rose around 5%.
Plywood
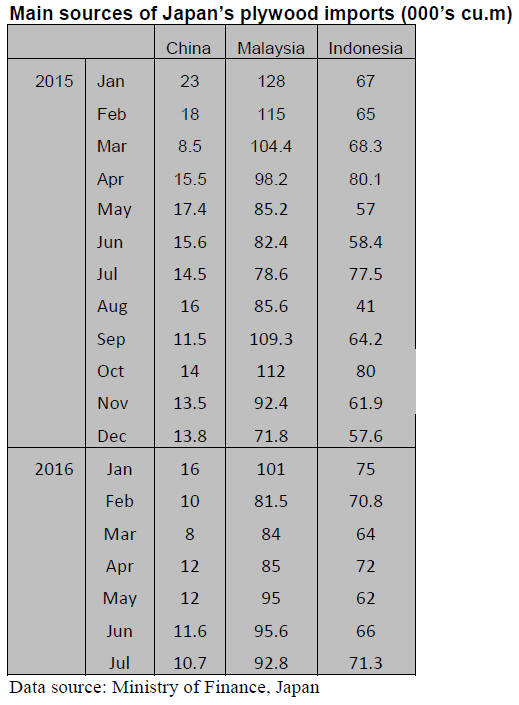
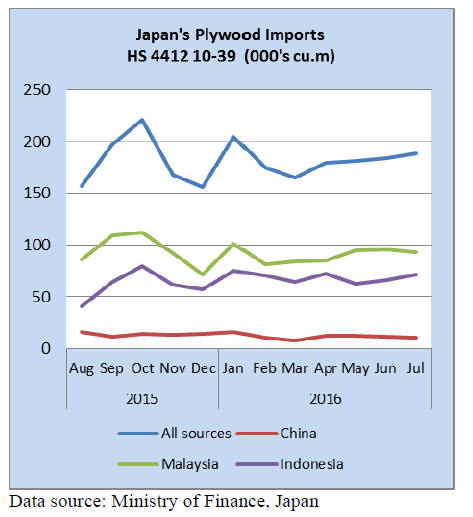
In July this year, as has been the case for a number of
years, the main suppliers of plywood to Japan are
Malaysia, Indnonesia and China in this order of rank.
Year on year July plywood imports were up slightly but
month on month shipments from overseas were flat.
Malaysia’s July shipment of plywood to Japan were up
20% year on year but month on month July imports fell
3%. It was only Malaysia which recorded a year on year
rise in shipments to Japan in July with both Indonesia and
China seeing a ddecline (27% in the case of China and 8%
in the case of Indonesia).
Trade news from the Japan Lumber Reports (JLR)
For the JLR report please see:
http://www.nmokuzai.
com/modules/general/index.php?id=7
Self-sufficiency of wood in 2015
The degree of self-sufficiency of wood in 2015 is 33.3%,
2.1 points up from 2014 and this is five straight years
improvement.
Total wood demand in 2015 is 75,300,000 cbm, 0.7% less
than 2014, out of which domestic wood is 25,060,000
cbm, 6.0 % up, which pushed the degree of selfsufficiency
up in 2015.
Total demand of industry use is 70,880,000 cbm, 2.3%
less. In this, domestic is 21,080,000 cbm, 1.4% more and
import is 49,090,000 cbm, 3.9% less so the degree of selfsufficiency
of wood of industry use is 30.8%.
In 2015, total housing starts are 910,000 units, 1.9% more
than 2014. In this, wood based units are 504,000, 3.0%
more but wood demand for housing starts decreased. In
particular, wood demand for lumber of both domestic and
import is lower than 2014. New demand of domestic wood
for laminated lumber and CLT has been developing and
construction of non-residential buildings like nursing
homes for aged people and kindergarten increased but this
is not reflected to the statistics.
Wood demand for plywood shows obvious trend of
shifting to domestic wood. Domestic wood increased by
5.5% while the imports are 18.1% less.
Because of significant drop of the imports, total
demand
decreased by 11.0% but the degree of self-sufficiency
moved up by 5.6 points.
Wood demand for fuel in 2015 increased by 39.5% out of
which domestic is 59.3% more. This pushed the degree of
self-sufficiency up significantly. Driving factor is
increasing use of unused wood for fuel after more wood
biomass power generation facilities increased by FIT
system. There were only 9 plants in 2014 then total
facilities in 2015 are 25 and more coming in 2016.
Wood demand by use
2015, it is necessary to add total demand of 3,700,000 cbm
and domestic supply of 14,940,000 cbm and degree of
self- sufficiency by 17.7 points.
July plywood supply
Total supply in July was 501,900 cbm, 11.9% more than
July last year and 1.2% more than June.
This is the first time that the supply reached 500,000 cbm
after six months. Production and shipment of domestic
plywood was over 260,000 cbm. Imported plywood
exceeded 230,000 cbm, first time in six months.
Domestic production in July was 267,000 cbm, 21.0%
more than July last year and 1.9% less than June.
In this, softwood plywood was 246,700 cbm, 23.6% more
and 1.8% less than June. Softwood structural panel was
238,800 cbm and non-structural panel was 7,900 cbm.
Shipment of softwood plywood was 250,000 cbm, 1.0%
less and 2.1% less. This is two straight months with
shipment of over 250,000 cbm. All the plywood mills
continue high production and shipment, supported by
active demand by major precutting plants. With busy
shipment, the inventories were 101,800 cbm, 3,000 cbm
less than June. The shipment exceeds the production.
Meantime, arrival volume of imported plywood in July
was 241,100 cbm, 3.6% more than July last year and 4.7%
more than June.
The arrivals for the second quarter were about 230 M cbm
a month then ordered volume has started coming in.
Malaysian volume was 95,700 cbm, 17.9% more and 2.9%
less. Indonesian volume was 78,300 cbm, 6.9% less and
6.8% more. Chinese volume was 51,800 cbm, 5.4% less
and 12.3% more.
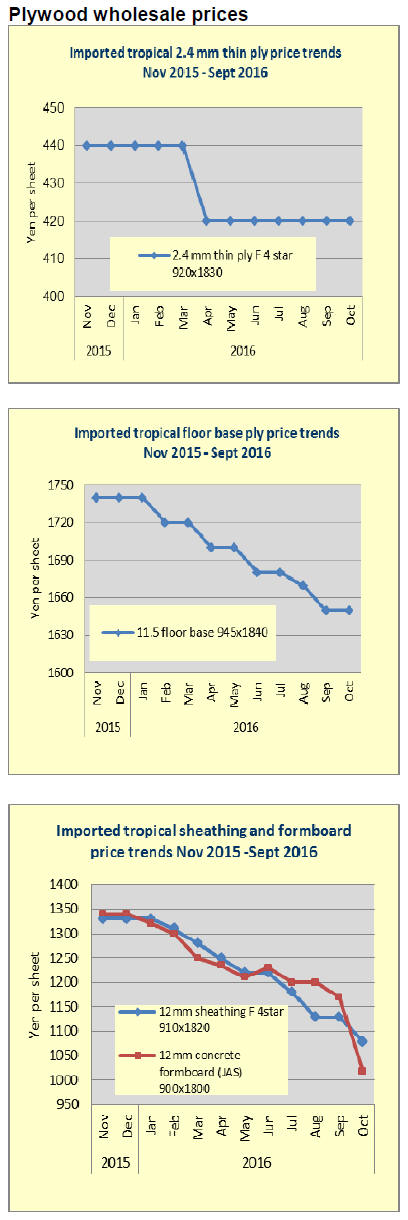
Domestic demand for concrete forming panel is slow and
future outlook is bearish due to strong yen so the importers
are reducing future ordered volume so the arrivals for the
fourth quarter will be low.
Plywood
Both production and shipment of domestic softwood
plywood continue brisk pace. August production was
229,900 cbm, 15.8% more than August last year and 6.8%
less than July.
The shipment was 238,900 cbm, 7.4% more and 4.5%
less. Considering the fact that August is vacation month
with the Bon holiday, it is amazingly high shipment.
The inventories finally dropped less than 100 M cbm to
92,900 cbm. Large precutting plants have enough orders
for October and even small and middle precutting
companies are busy with orders from local contractors and
consigned orders from large precutting companies so they
also feel tight plywood supply. For them, regular orders
are filled by the suppliers but delivery of additional orders
is delayed so they feel uneasy if they should accept more
precutting orders.
In Hokkaido, where shortage is notable, to supplement
short supply, they use imported larch plywood and South
Sea(tropical)structural hardwood plywood.
Plywood conference by three countries
On September 19, plywood conference by three countries
was held at Sarawak, Malaysia. 46 people attended from
Indonesian Plywood Association (Apkindo), Malaysian
Timber Producers Association (STIA), Sarawak Timber
Association (STA) and the Japan Lumber Importers
Association, Japan Federation of Plywood Manufacturers
Association.
In the discussion, STA understand the situation of Japan
market. Despite announcement of STA’s production
curtailment announcement, price of concrete forming
panels in Japan weakened by advancing appreciation of
the yen but it expressed uneasy prospect to the future.
Despite steady new housing starts and very low
inventories of imported plywood in Japan, orders for
plywood mills have not increased and the prices remain
depressed.
Japan side asked if the production curtailment is really
performed. Malaysian side says this is gentlemen’s
agreement but export volume would tell the result. STA
commented that it would continue supply reduction until
there will be some change in Japan market.
Also supply side asked about the Japanese is aiming to
achieve degree of self-sufficiency of wood to 50%, which
would impact import products. For this, Japan side
explained that there are no other materials to replace
tropical hardwood plywood in quality. There are some
domestic products to replace South Sea plywood but
balance of 50% imports and 50% domestic will be kept
without any drastic change for a time being.
Japan side explained that domestic demand of plywood
will decline in a long run with decreasing population so it
is necessary to develop overseas market, which is the
common problem for plywood manufacturers in Malaysia
and Indonesia in future so three countries need to work
together to develop new markets.
|