|
Report from
North America
Tropical plywood suppliers gain market share
Hardwood plywood imports were slightly down in June
from the previous month, but overall the monthly import
volume is not much lower than in previous years, before
the US anti-dumping and countervailing duties were put in
place for plywood from China.
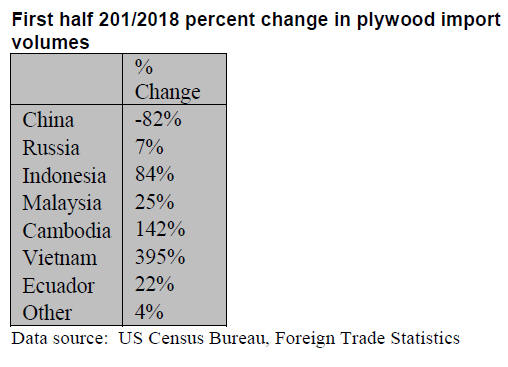
Higher imports from all tropical suppliers made up in part
for lower imports from China. Year-to-date plywood
imports from Indonesia were up 84% compared to June
2017.
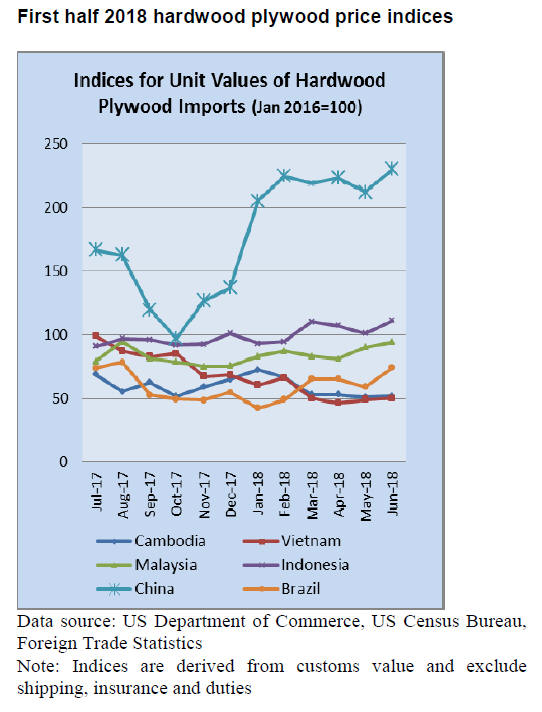
The value of plywood imports was almost unchanged from
May because of higher prices of plywood from China
(excluding duties), Indonesia and Malaysia.
Higher moulding and flooring imports
Hardwood flooring imports were worth over US$6 million
in June, up 40% year-to-date compared to June 2017.
China remains the largest source of imports, but imports
from Malaysia and Brazil doubled year-to-date.
Imports for assembled flooring panels (laminate,
engineered) declined in June. While China and Canada
dominate U.S. imports, Thailand and Vietnam have
become significant new sources of assembled flooring. In
the first half of 2018 Thailand and Vietnam each
accounted for 4% of total U.S. imports of assembled
flooring.
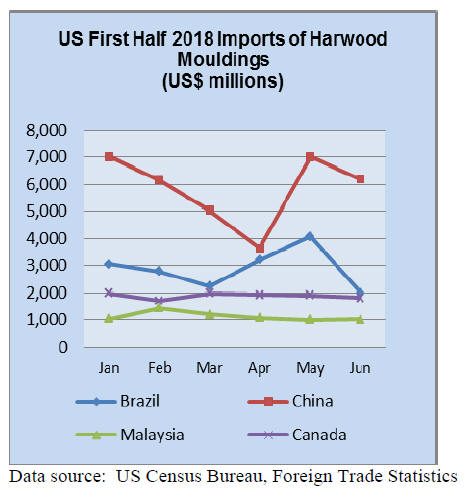
Hardwood moulding imports were down in June from the
previous month, with the exception of imports from
Malaysia. Imports from Malaysia grew 24% year-to-date
compared to June 2017.
Higher US furniture imports from China
Wooden furniture imports grew 2% in June to US$1.71
billion. Imports in the first half of 2018 were 6% higher
than during the same time period in 2017.
The month-over-month growth was entirely in furniture
imports from China, while imports from most other
countries fell. The increase in furniture imports from
China could be in response to potential tariffs. While
tariffs specifically on furniture had not been announced at
that time, by end of July the Trump Administration
confirmed it would raise tariffs from 10% to 25% on
US$200 billion worth of products from China.
Imports of upholstered, kitchen and office furniture grew
in June, while wooden seating and bedroom furniture
declined.
US wood product manufacturing slows
Retail sales at furniture and home furnishing stores grew
5% year-to-date in July, compared to July 2017 (U.S.
Census Bureau, Advance Monthly Retail Trade Survey).
Retail sales did not change much in July from sales in June
and May.
The Kitchen Cabinet Manufacturers Association reported
a 1% growth in year-to-date cabinet sales in June
compared to last year.
The wood products and furniture industries reported
growth in July, but at a lower rate than most other
manufacturing industries, according to the Institute for
Supply ManagementˇŻs Manufacturing (ISM) Business
Survey. One of the surveyˇŻs respondents in the wood
products sector commented that the trade war and lower
demand from export markets like China has affected
business.
GDP growth estimated at 4.1% in Q2
GDP growth increased to 4.1% in the second quarter based
on the advance estimate by the Bureau of Economic
Analysis. In the first quarter of 2018 GDP grew 2.2%.
Increased personal spending, exports and government
spending contributed to GDP growth in the second quarter.
The unemployment rate edged down to 3.9% in July,
according to the U.S. Bureau of Labor Statistics.
Modest growth in home construction
Low unemployment and a strong economy support
demand for housing, but housing starts grew only 0.9% in
July at a seasonally adjusted annual rate, according to the
U.S. Department of Housing and Urban Development and
the Commerce Department. Building permits were slightly
up from June.
The high cost of building materials and labour contribute
to the slow growth in the housing market, along with
worsening affordability. Housing affordability in the
second quarter of 2018 was the lowest in ten years,
according to the National Association of Home Builders
(NAHB)/Wells Fargo Housing Opportunity Index, due to
rising construction costs and interest rates.
|