|
Report from
Europe
Second consecutive year of growth in EU tropical
timber imports
Despite a downturn in the last six months of 2019, EU
imports of tropical wood products last year were greater
than in 2018.
In 2019, the EU28 imported 2.13 million tonnes of tropical
wood products (including all those in HS Chapter 44
except fuelwood, wood waste and chips) with a total value
of €2.32 billion, respectively 1.5% and 3.2% greater than
the previous year. This was the second consecutive year of
import growth after a dip in 2017.
The marginal growth in imports in 2019 was driven
mainly by a recovery in imports of sawnwood from
Cameroon and of sawnwood and mouldings/decking from
Brazil, particularly into Belgium, together with rising
imports of a variety of joinery products (doors and
laminates) from Indonesia and Malaysia. These gains
offset falling imports of tropical logs, charcoal, plywood,
and veneers last year.
When considering the longer-term trend, imports in 2019
are very much in line with the overall stasis in EU tropical
wood trade after hitting an all-time low in 2013 following
the financial crises. Since then EU imports have fluctuated
within a narrow band around 2 million tonnes (Chart 1).
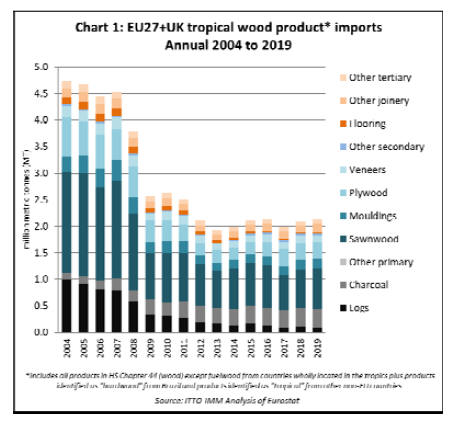
Over the last seven years, total EU imports of tropical
sawnwood have fluctuated in the region of 750,000 tonnes
without showing any strong upward or downward trend.
During this period, there has been a continuing decline in
imports of tropical logs and flooring products.
However, these losses have been offset by rising EU
imports of charcoal and a variety of laminated and other
joinery products from tropical countries and a recovery in
imports of tropical mouldings/decking and tropical
hardwood faced plywood (although the latter is
increasingly sourced from China and destined for the UK,
which ceased to be an EU country on 31st January 2019).
(Note that since the UK was still an EU country
throughout 2019, all references to the EU in the following
report on import trends last year refers to the EU28
inclusive of the UK).
EU imports of tropical sawnwood rise 5% in 2019
EU imports of tropical sawnwood increased 5% to
753,000 tonnes in 2019 while import value declined
slightly, by 0.1% to €728.1 million. EU traders reported
generally steady, in some cases strong, trading conditions
for tropical timber in the first half of 2019 followed by a
distinct slowdown in the second half as uncertainty
mounted over the wider economic picture.
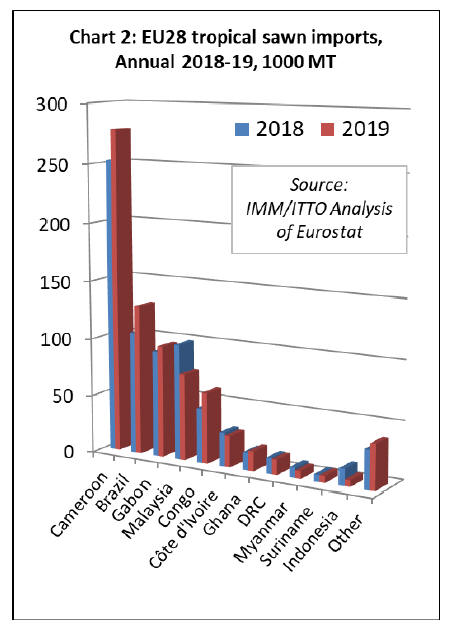
Imports from Cameroon, particularly slow in 2018,
increased 10% to 277,600 tonnes during 2019. Imports
also increased from several other countries including
Brazil (up 23% to 129,100 tonnes), Gabon (up 5% to
96,300 tonnes), Congo (up 28% to 60,900 tonnes), and
Ghana (up 12% to 17,000 tonnes). After a strong start to
2019, imports from DRC were 13,100 tonnes over the
entire year, down 5% on 2018. These gains offset a 25%
decline in imports from Malaysia, to 74,500 tonnes, an 8%
decline from Côte d'Ivoire to 27,200 tonnes, and a 24%
decline in imports from Myanmar, to 6,800 tonnes (Chart
2).
The decline in EU imports from Malaysia in 2019 was
attributed by some importers to a decline in the availability
of PEFC certified product following the suspension of
MTCS certification in Johor and Kedar states in May 2019
which led to the total certified area in Malaysia to fall by
around 25%.
This may have been a factor in the Netherlands and UK
where there is a stronger preference for certified wood.
However, rising EU imports from other tropical countries
with even less access to certified wood, such as Cameroon
and Brazil, implies that other factors were also important
for the decline in imports from Malaysia.
For example, Malaysian mills have been held back by raw
material shortages and Malaysian products have come
under growing competitive price pressure from Brazilian
products. This is partly due to exchange rate movements.
The value of the Brazilian real is currently at historically
very low levels on international currency exchange
markets and has lost nearly 50% against the euro in the
last decade which has meant that Brazilian producers are
more inclined to export. In contrast the Malaysian
currency has lost less than 10% against the euro over the
same period.
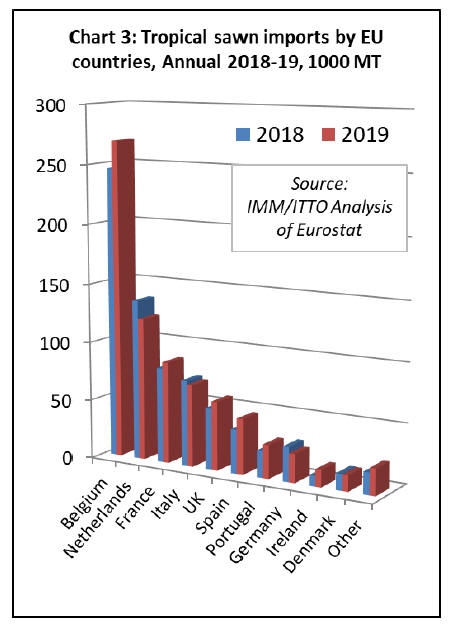
The trend towards increased concentration of tropical
sawnwood imports into the EU by way of Belgium
continued in 2019 (Chart 3). Belgian imports increased
10% to 269,100 tonnes last year, with the country
accounting for much of the gain in EU imports from
Brazil, Gabon and the Congo Republic. In contrast
Belgian imports of sawnwood from Malaysia and DRC
declined last year. Belgian imports from Cameroon, by far
the largest supplier of tropical sawnwood, to Belgium
accounting for around 45% of the total, remained stable at
120,000 tonnes last year.
Imports of tropical sawnwood into the Netherlands
declined by 11% to 120,600 tonnes in 2019. There was a
significant increase in Dutch imports from Brazil and
Cameroon offset by a large decline in imports from
Malaysia and Indonesia.
Imports of tropical sawnwood into France increased 7%
last year, to 85,800 tonnes, the second consecutive year of
gains after a 25% downturn in 2017. Imports increased
from all four of the leading supply countries to France -
Cameroon, Brazil, the Republic of Congo, and Gabon ¨C
but declined from Malaysia.
There was also a slight increase in French imports from
Madagascar last year ¨C France being the only EU country
importing anything other than negligible volumes (4450
tonnes in 2019) from the country.
ItalyˇŻs imports of tropical sawnwood fell 4% to 69,100
tonnes in 2019, with imports down from both Cameroon
and Gabon, the two leading suppliers. Italian sawnwood
imports from Côte d'Ivoire recovered a little ground in
2019 after several years of continual decline but, at less
than 7,000 tonnes, were still only around half the level of
three years before. Italian imports from Myanmar last year
were 4,400 tonnes, a slight gain on 4,300 tonnes in 2018
and double the volume of 2017.
The UK imported 57,900 tonnes of tropical sawnwood in
2019, 12% more than the previous year with significant
gains in imports from Cameroon, Republic of Congo,
DRC and Brazil offsetting a decline in imports from
Malaysian and Côte d'Ivoire. Imports of tropical
sawnwood into Ireland made even larger gains, but from a
smaller base, rising 64% to 14,500 tonnes, sourced almost
exclusively from Cameroon.
Tropical sawnwood imports into Spain and Portugal also
made significant gains last year, respectively rising 26% to
46,600 tonnes and 25% to 28,500 tonnes. Imports into
Spain and Portugal derive mainly from Cameroon and
Brazil, and imports from both countries increased in both
Spain and Portugal last year. Spain also recorded gains in
imports from the Republic of Congo and Gabon. However,
PortugalˇŻs imports from these two latter countries
declined, losses only offset by a recovery in PortugalˇŻs
imports from Angola.
GermanyˇŻs direct imports of tropical sawnwood suffered
another downturn last year, falling 18% to only 24,300
tonnes. Imports fell from both Cameroon and Brazil,
partly offset by a rise in imports from Ghana. Germany is
now by far the largest direct EU importer of Ghanaian
sawn timber, taking 6,300 tonnes last year, nearly twice
the volume of Belgium, the next largest importer.
However, for imports from other tropical countries,
Germany is increasingly dependent on indirect trade via
Belgium and the Netherlands.
After a continuous rise between 2014 and 2018,
DenmarkˇŻs imports of tropical sawnwood fell 2% to
13,600 tonnes in 2019. Nearly all the gains in recent year
have been from Brazil and, to a lesser extent Peru, and
Danish imports from the two South American countries
continued to rise in 2019.
Imports from Ecuador (likely of balsa wood, possibly to
supply the wind turbine industry) also increased sharply
from only 336 tonnes to 1100 tonnes last year. However,
these gains were offset by a fall in Danish imports from
Republic of Congo and Cameroon.
EU imports of tropical logs slow in second half of 2019
After recovering ground in 2018 and stabilising in the first
half of 2019, EU imports of tropical logs slowed in the
second half of 2019. Imports of 98,600 tonnes in 2019
were 13% less than in 2018 while import value fell 14% to
€48.4 million during the year.
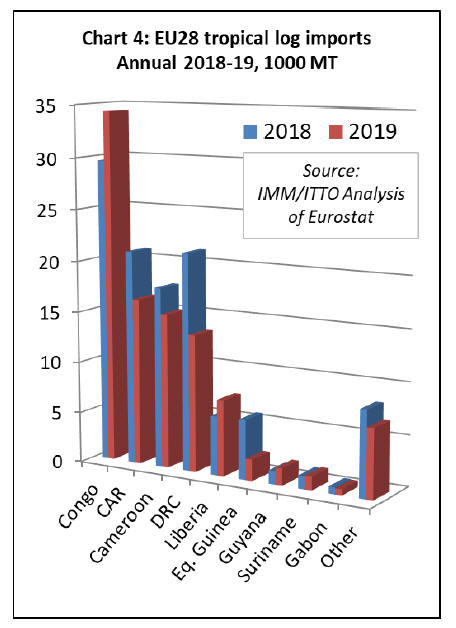
In 2019, EU imports of tropical logs increased by 16% to
34,400 tonnes from the Republic of Congo, the leading
supplier, by 29% from Liberia to 7,500 tonnes, by 7%
from Suriname to 1,400 tonnes, and by 27% from Guyana
to 1,700 tonnes. However, these gains were offset by
falling imports from the Central African Republic (-22%
to 16,300 tonnes), DRC (-37% to 13,400 tonnes),
Cameroon (-14% to 15,100 tonnes), and Equatorial Guinea
(-64% to 2,100 tonnes) (Chart 4).
After a more buoyant second quarter, imports of tropical
logs slowed into France and Belgium in the second half of
2019.
By the end of the year, France had imported 36,400 tonnes
of tropical logs, 8% less than in 2018, while imports into
Belgium were down 23%, at 23,600 tonnes. Imports were
also down 22% to 15,200 tonnes in Portugal during the
year.
Rising log imports in some smaller markets, including
Italy (+3% to 10,800 MT), the Netherlands (+18% to
2,500 tonnes), Spain (+12% to 2,600 tonnes) and Greece
(+23% to 2,300 tonnes) were insufficient to offset falling
imports in France, Belgium and Portugal.
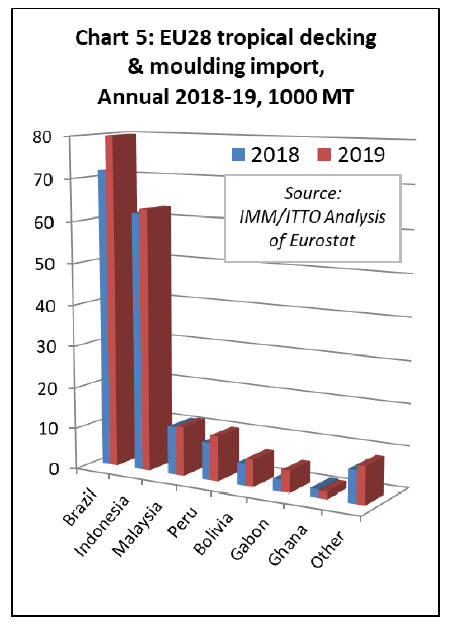
EU imports of tropical mouldings/decking up 9% last
year
Bouyant trade in the first three quarters of 2019 drove a
9% gain in EU imports of tropical mouldings (which
includes both interior mouldings and exterior decking
products) to 188,100 tonnes for the year as a whole despite
of a sharp slowdown in the last quarter. The value of EU
imports of tropical mouldings/decking in 2019 was €294.6
million, 14% more than the previous year.
EU imports of tropical mouldings/decking increased from
all the leading suppliers of this commodity in 2019
including Brazil (+12% to 79,900 tonnes), Indonesia (+2%
to 62,900 tonnes), Peru (+20% to 10,900 tonnes),
Malaysia (+2% to 11,900 tonnes), Gabon (+85% to 5,200
tonnes) and Bolivia (+24% to 6,500 tonnes) (Chart 5).
In 2019, imports of tropical mouldings/decking increased
in France (+25% to 60,100 tonnes), Netherlands (+27% to
32,500 tonnes), the UK (+8% to 11,300 tonnes), Italy
(+11% to 7,900 tonnes) and Denmark (+0.4% to 4,900
tonnes). However, imports weakened in Germany, down
10% to 33,000 tonnes, and Belgium, down 12% to 25,700
tonnes.
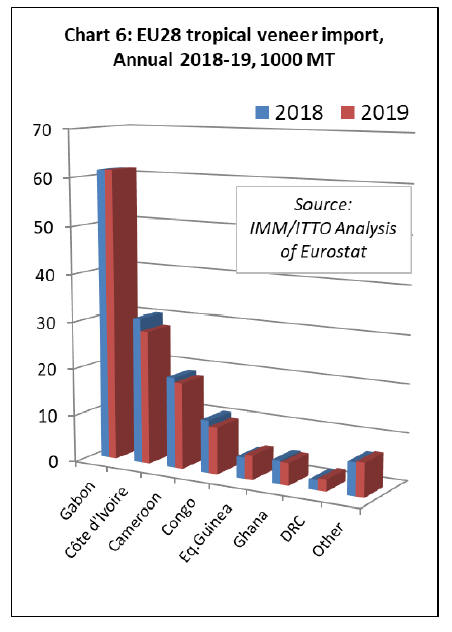
EU imports of tropical veneer fall 3% in 2019
Following a similar trajectory to sawn hardwood imports,
EU imports of tropical veneer slowed in the second half of
2019 after a strong performance in the first six months of
the year. Imports, which were up 10% on the previous
year in the first half of 2019, ended the year at 137,200
tonnes, 3% down on 2018. Import value decreased 4% to
€175.6 million during the year.
The EU imported 61,400 tonnes of veneer from Gabon in
2019, just 0.1% more than in 2018. Imports declined from
Cote dˇŻIvoire (-8% to 28,300 MT), Cameroon (-5% to
18,200 tonnes), Republic of Congo (-11% to 10,000
tonnes), and Ghana (-6% to 4,700 tonnes). However, there
were some gains from Equatorial Guinea (+15% to 5,100
tonnes) and DRC (+16% to 2,500 tonnes) (Chart 6).
In 2019, tropical veneer imports increased by 1% in
France to 49,600 tonnes, by 7% in Italy to 35,500 tonnes,
by 12% in Greece to 12,400 tonnes, and by 4% in
Romania to 6,100 tonnes. However, imports fell by 18%
in Spain, to 20,700 tonnes, and by 21% in Germany, to
4,000 tonnes. Imports by Belgium were stable, at 4,700
tonnes.
The downturn in tropical veneer imports in the second half
of 2019 is partly allied to weakness in the European
plywood and door manufacturing sectors during this
period. There are also signs that tropical wood veneer is
coming under pressure from temperate wood substitutes
and a wide range of artificial surface materials.
It is notable that EU imports of American hardwood
veneers in 2019 (21,200 tonnes) were also down by over
10%, registering significant declines in white oak and
walnut in several markets including Spain, Portugal, UK
and Belgium.
Imports from Ukraine, which have risen dramatically in
recent years, stabilised at a high level (63,000 tonnes) in
2019, while imports from Russia (41,000 tonnes) and
Serbia (25,300 tonnes) continued to rise.
Large Chinese suppliers dominate UK tropical
plywood imports
EU imports of tropical plywood products, which were 5%
up on the previous year after the first three quarters of
2019, ended the year 5% down compared to 2018 at
313,000 tonnes.
Import value was also down 5% at €278.4 million. The
pace of imports fell dramatically in the face of a tightening
market and highly competitive conditions, with
particularly low prices for Russian birch plywood and
Chinese mixed hardwood products that have been taking
market share from tropical products.
A large and growing proportion of the plywood faced with
tropical hardwood imported into the EU is manufactured
in China. The EU imported 135,100 tonnes of this product
from China in 2019, 11% more than in 2018.
When linked with news that numerous smaller mills in
China have closed in recent years due to new emissions
controls, and anecdotal reports from European buyers of a
greater focus on quality and species content due to EUTR
and CE Marking requirements, the strong implication is
that the trade is becoming more concentrated amongst a
few large consolidated suppliers in China.
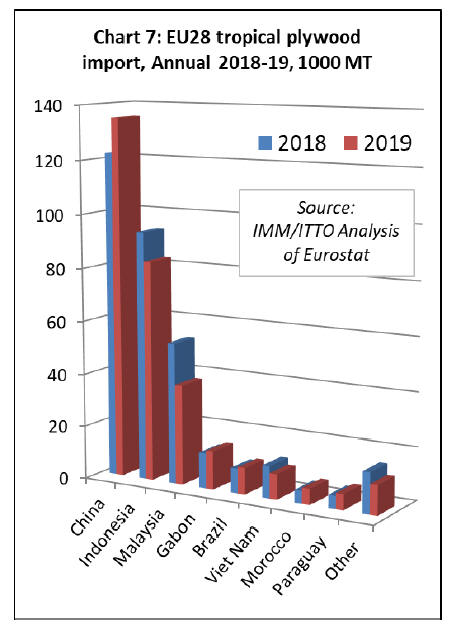
Although direct imports of plywood increased from a few
smaller tropical suppliers in 2019, the total volume was
down 14% at 166,800 tonnes. Imports increased from
Gabon by 9% to 14,500 tonnes, from Brazil by 8% to
10,000 tonnes, from Morocco by 26% to 6,100 MT, and
from Paraguay by 23% to 6,000 tonnes.
However, these gains were not enough offset to declining
plywood imports from the two largest tropical suppliers,
Indonesia and Malaysia. Imports from Indonesia declined
11% to 82,800 tonnes and fell 29% from Malaysia to
37,700 tonnes.
A brief surge in imports from Viet Nam earlier in the year
also faltered in the second half so that total imports were
down 21% at 9,500 tonnes by the end of 2019. (Chart 7).
In 2019, UK imports of tropical plywood products
increased 6% to 174,700 tonnes, despite widespread
reports of overstocking and declining plywood
consumption in the country. UK imports of tropical
hardwood plywood from China increased by 36% to
95,300 tonnes in 2019, while UK imports from Indonesia
fell 12%, to 34,200 tonnes, and were down 27% from
Malaysia to 33,000 tonnes.
In contrast to the UK, tropical plywood imports declined
into all other major EU markets in 2019, including
Belgium (-35% to 31,700 tonnes), Netherlands (-4% to
32,100 tonnes), Germany (-8% to 24,200 tonnes), France
(-4% to 18,500 tonnes), Italy (-12% to 15,800 tonnes), and
Greece (-12% to 2,800 tonnes).
For advocates of FLEGT licensing, there was some
consolation in that direct imports of plywood from
Indonesia increased in 2019 into the Netherlands (+6% to
13,000 tonnes) and Germany (+5% to 17,700 tonnes)
despite the overall weakness of the market. Imports of
Indonesian plywood by the Netherlands last year were
double those of 2016 just before licensing started.
However, the gains made in these markets in 2019 were
not enough offset declining imports last year into the UK
and Belgium.
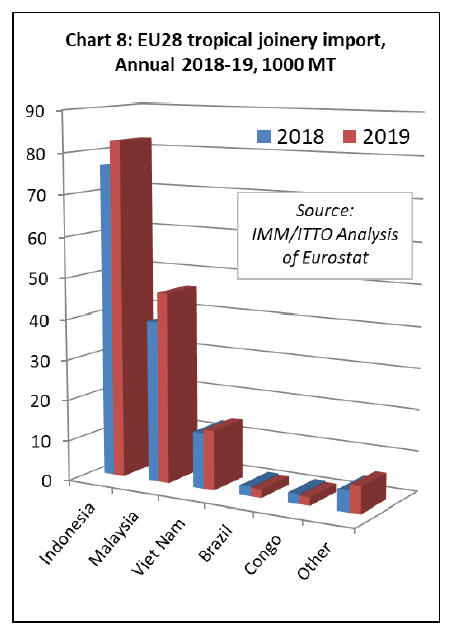
Rising EU imports of joinery from Indonesia and
Malaysia
EU imports of tropical joinery products, mainly doors
(from Indonesia), and laminated window scantlings and
kitchen tops (from Indonesia, Malaysia and Viet Nam),
increased 11% to 154,500 tonnes in 2019. Import value
increased 16% to €315.8 million.
EU imports in 2019 increased from all three of the
countries that dominate international trade in tropical
joinery products including Indonesia (+8% to 82,500
tonnes), Malaysia (+18% to 46,600 tonnes), and Viet Nam
(+6% to 14,700 MT) (Chart 8).
In 2019, imports of tropical joinery products increased by
4% to 63,200 tonnes in the UK and by 42% to 48,200
tonnes in the Netherlands. There were also significant
gains in two smaller markets for tropical joinery products,
Ireland increasing 54% to 3,000 tonnes and Poland up
17% to 1,700 tonnes. These gains offset a 5% fall in
Belgium to 16,900 tonnes, an 18% fall in France to 10,500
tonnes, and a 6% fall in Germany to 7,700 tonnes.
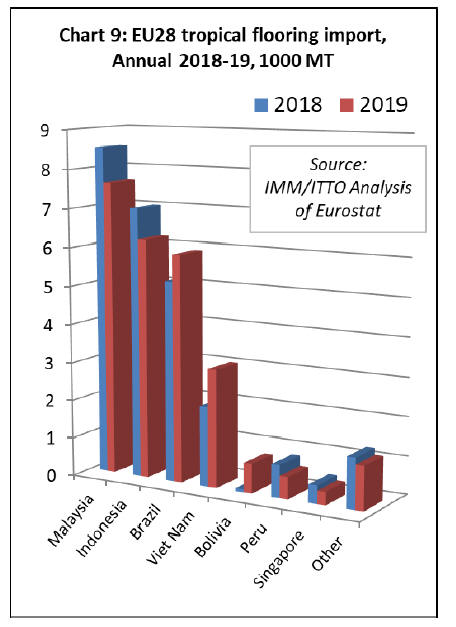
First rise in EU imports of tropical flooring since the
financial crises
EU imports of flooring products from tropical countries
increased 0.5% to 25,690 tonnes in 2019, while import
value was up 1.2% at €59.4 million. These gains are small
but are significant for being the first increase in EU
imports of tropical flooring since 2007 before the financial
crises.
Between 2007 and 2018, EU imports of tropical flooring
products fell continuously from 150,000 tonnes to only
25,550 tonnes in response to intense competition from
European and Chinese manufacturers and non-wood
alternatives, fashion trends favouring temperate timbers,
supply contraints, and challenges of EUTR conformance.
In 2019, a continuing decline in imports from the leading
suppliers ¨C Malaysia (-10% to 7,600 tonnes), Indonesia (-
11% to 6,200 MT) ¨C was offset by rising imports from
Brazil (+14% to 5,900 tonnes), Viet Nam (+48% to 3,100
MT), and Bolivia (from near zero to over 800 tonnes)
(Chart 9).
In 2019, tropical wood flooring imports recovered ground
in France (+36% to 7,700 tonnes) and the UK (+27% to
2,500 tonnes). However, imports fell in most other
significant European markets including Belgium (-0.5% to
3,300 tonnes), Italy (-9% to 2,100 tonnes), Denmark (-
28% to 2,000 tonnes), Spain (-30% to 1,900 tonnes), the
Netherlands (-5% to 1,900 tonnes), and Germany (-16% to
1,700 tonnes).
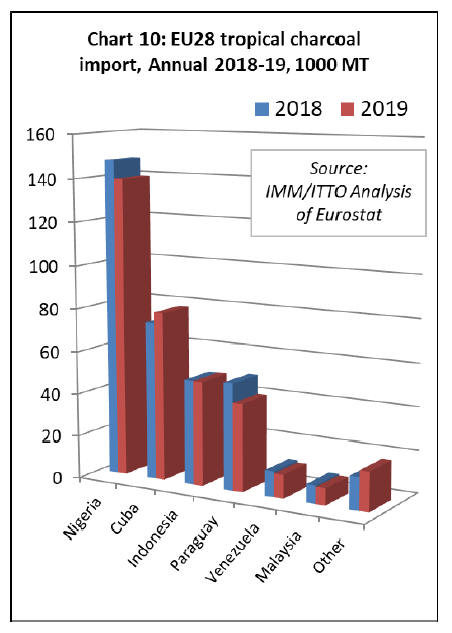
Slowing pace of EU imports of tropical charcoal
EU imports of charcoal from tropical countries, which
were rising between 2016 and 2018, fell 3% to 345,300
tonnes in 2019. Import value was level at €141.4 million
in both 2018 and 2019.
In 2019, EU imports of charcoal decreased from Nigeria (-
6% to 139,400 tonnes), Paraguay (-18% to 40,900 tonnes),
Venezuela (-7% to 11,200 tonnes), and Malaysia (-8% to
7,900 tonnes). However, imports from Cuba increased 7%
to 78,800 tonnes. Imports from Indonesia were unchanged
at 48,800 tonnes in 2019 (Chart 10).
A wide range of EU countries now import wood charcoal
from tropical countries. The largest destinations (in
descending order in 2019) were: Poland (-14% to 49,100
tonnes); Greece (-3% to 47,900 tonnes); Portugal (+9% to
41,400 tonnes); Spain (+21% to 37,900 tonnes); Italy
(+6% to 34,000 tonnes); Germany (-38% to 30,200
tonnes); UK (+2% to 30,000 tonnes); Netherlands (+45%
to 22,600 tonnes); Belgium (-39% to 17,100 tonnes), and
Croatia (+137% to 6,600 tonnes).
|