|
Report from
North America
Imports of tropical hardwood products slumped in
September
After US imports hit a number of post-pandemic highs in
August, imports of tropical hardwood and related products
retreated in September, including some dramatic losses in
certain categories.
Imports of sawn tropical hardwood fell 30% in September,
while imports of wooden furniture fell 18%, and imports
of tropical hardwood veneer plunged 60%. Moulding and
flooring imports also fell slightly.
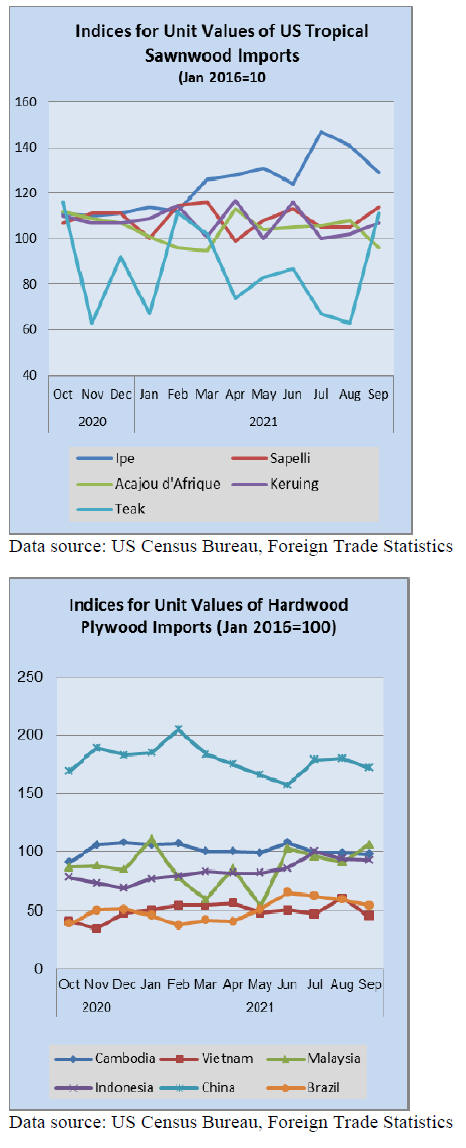
Sawn tropical hardwood imports tumble again
US imports of sawn tropical hardwood fell sharply for a
second straight month, declining by 30% in September.
The 6,407 cubic meters imported in September represents
the lowest volume imported since February and a far cry
from the more than 12,000 cubic meters imported in July.
Imports from Brazil were down 73% while imports from
Ecuador and Ghana both fell 62%.
Imports of Virola, Balsa, Sapelli, and Mahogany all
dipped sharply, falling from very strong summer volume.
Despite seeing its weakest month in more than three years
in September, Virola imports remain ahead of last year by
25% year to date. September Mahogany imports, while
down from August, still more than quadrupled September
2020 volume and are up 171% year to date over last year.
Balsa imports in September, however, were less than a
third of their September 2020 volume and are down 19%
year to date.
Ipe and Jatoba imports, which beginning this year are no
longer counted as part of the tropical hardwood totals in
the official US government figures, were mixed in
September. Ipe imports rose 31% in September and are
down 1% year to date versus 2020 volume, while Jatoba
imports fell 4% in September but are up 56% year to date.
If we count these two woods, September US sawn tropical
hardwood imports fell by only 13% in September and are
up 21% year to date.
Canadian imports of sawn tropical hardwood fell for the
fifth straight month in September. Monthly imports
declined 24% as imports from Cameroon, Indonesia, and
Malaysia all fell sharply. Even with the continued decline,
total imports are up 8% year to date through August.
Hardwood plywood imports cool, but remain at
elevated levels
US imports of hardwood plywood fell 7% in September
but remain at a high pace historically. The import volume
of 305,281 cubic meters is nearly 50% above that of the
previous September, keeping year-to-date volume up 34%
over 2020. While imports from Malaysia, Indonesia,
China, and Ecuador all declined in September, imports
from each of these countries are outpacing 2020 volume
year to date. Imports from Vietnam jumped 59% in
September, reaching its highest monthly level on record.
Veneer imports fall to record low
US imports of tropical hardwood veneer fell for the third
straight month, plunging 60% in September after a 12%
decrease in August. Monthly imports fell below US$1
million for the first time since we began tracking the
category five years ago.
Imports from China and India were non-existent and
imports from Italy fell by more than 99%.
While these imports historically tend to recede in
September, this decline was an outlier. The historically
poor month was 30% less than imports from last
September, pushing 2021 imports for the year behind 2020
totals by 4%.
Hardwood flooring imports pull back
US imports of hardwood flooring saw a modest retreat in
September, falling 3%but still to a level still 35% higher
than the previous September. A 265% increase in imports
from Vietnam made up for sharp decreases in imports
from Indonesia, Malaysia, and China. Imports from
Indonesia were the lowest since February and are down
51% year to date. Overall hardwood flooring imports are
up 39% year to date.
Imports of assembled flooring panels fell by 16% in
September, ending six months of continuous growth.
While imports from Canada and Indonesia both grew by
around 25%, imports from China, Vietnam and Thailand
all fell around 35%.
Imports from Brazil dropped by 54% but are still up nearly
500% year to date. Year-to-date imports are up sharply
from nearly all trading partners except Canada. Imports
from Canada are only up 2% year to date compared with
overall imports which are ahead 59% year to date.
However, all year-to-date numbers should be viewed as
inflated as the USDA added two additional categories to
the Assembled Flooring Panels category in May.
Moulding imports stay near post-pandemic record
US imports of hardwood moulding remained flat in
September falling less than 1% from the previous month to
stay at a level not seen since 2018. Imports from China fell
11% but came in more than 40% higher than the previous
September.
However, imports from China are still down 50% year to
date. Imports from Malaysia made up for the loss, gaining
43% in September to be ahead 44% year to date. Overall
US imports of hardwood moulding are up 23% year to
date over 2020.
Wooden furniture imports fell below US$2 billion in
September
US imports of wooden furniture fell by 18% in September,
dropping to their lowest level since February. Imports fell
to US$1.85 billion in September, only the second time this
year a month was below US$2 billion and the first time
this year a monthly total was below that of the previous
year.
Imports from Vietnam were down 35% while imports
from Indonesia and Malaysia were both down 13%.
Overall, US wooden furniture imports have been strong all
year and remain up 46% year to date with imports from all
major trading partners up at least 10% for the year so far.
Cabinet sales showed gains in August
According to the Kitchen Cabinet Manufacturers
AssociationˇŻs (KCMA) monthly ˇ®Trend of Business
SurveyˇŻ participating cabinet manufacturers reported an
increase in overall cabinet sales of 5.5% in
August, up 8.0% compared with August 2020. Custom
sales were up 5.7%, semi-custom sales increased 2.1% and
stock sales rose 7.5%.
Year-to-date sales remain strong across the board. Overall
cabinet sales are up 16.9% when compared to the same
period in 2020. Custom sales up 20.4%, semi-custom sales
increased 14.9% and stock sales increased 17.6%.
See:
https://www.kcma.org/news/pressreleases/August_2021_trend_of_busines_press_release
|