|
Report from
North America
Sawn tropical hardwood imports dip in US, jump in
Canada
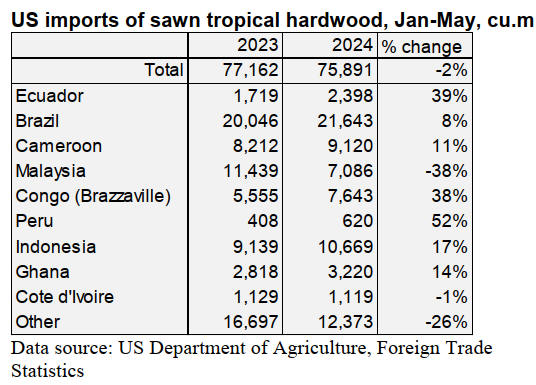
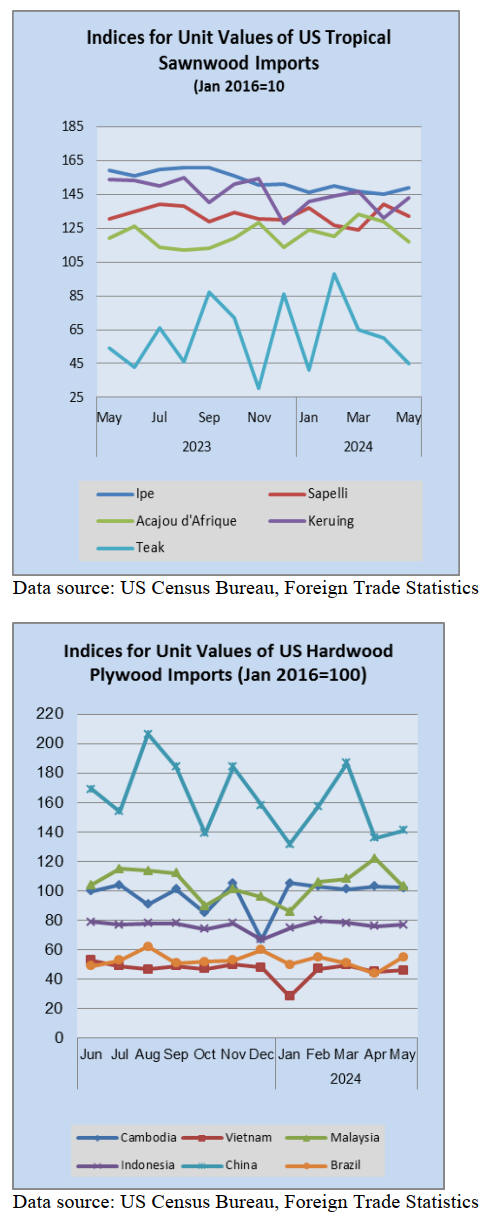
US imports of sawn tropical hardwood tumbled 15% in
May, falling to their lowest level of the year. The 13,474
cubic metres imported was the lowest volume since
December and was 14% less than in May 2023.
Imports from Brazil and Cameroon both fell by more than
one-third while imports from Ghana dropped by more than
half. Imports from Indonesia remained strong and steady,
rising 5% for the month.
Imports of Keruing grew 45% in May but are still well
below last year’s levels while imports of Ipe, Meranti, and
Acajou d’Afrique all fell by more than 30%. Total
imports versus last year are down 2% through May.
Canada’s imports of sawn tropical hardwood leapt 30% in
May. Imports for the month were well over twice the level
of the previous May. Imports from Cameroon rose 27%
and for the year so far are nearly double that of last year,
while imports from Bolivia have also enjoyed sharp
growth. Canada’s imports from the US, however, continue
to ebb, falling 79% in May and down 57% for the year so
far versus last year. Canada’s total imports of sawn
tropical hardwood are ahead of last year to date by 38%.
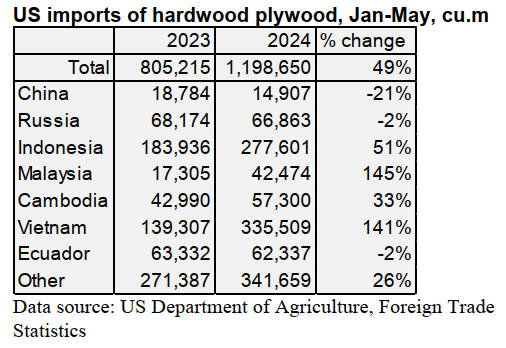
US hardwood plywood imports remain elevated
While US imports of hardwood plywood rose by only 1%
in May, volume continues to greatly outpace imports from
last year. The 242,285 cubic metres imported in May was
11% higher than last May, keeping total imports through
the first five months of the year up nearly 50% over 2023.
Imports from Russia increased more than five-fold in May
to their strongest month since October 2022. Imports from
Malaysia and Vietnam both continued to move up in May
as imports from each country are up more than 140% over
the first five months of the year.
US imports of tropical hardwood veneer gained 40% in
May
US imports of tropical hardwood veneer rose for the third
consecutive month in May, rising a healthy 40% by value
in May over the previous month.
Imports for the month were 10% better than the previous
May—the first time this year monthly imports
outperformed 2023. The gain came despite another poor
month of imports from Italy. Imports from Italy were
nearly non-existent in May leaving year-to-date imports
from Italy down 84%.
Sharply rising imports from India and Cameroon more
than made up the loss, while imports from Cameroon
continue their solid growth. While May’s numbers
narrowed the gap, total imports for the year so far are still
down 12% from 2023.
Hardwood flooring imports surge
The value of US imports of hardwood flooring rebounded
in May, surging 38% over the previous month. Despite the
gain, imports for the month were still short of May 2023
by 2%. The surge in May was fueled by a 292% increase
in imports from Malaysia and a doubling of imports from
Brazil.
Imports from China and Indonesia also showed sizable
gains. Year-to-date imports of hardwood flooring are
down 17% versus the same period for 2023.
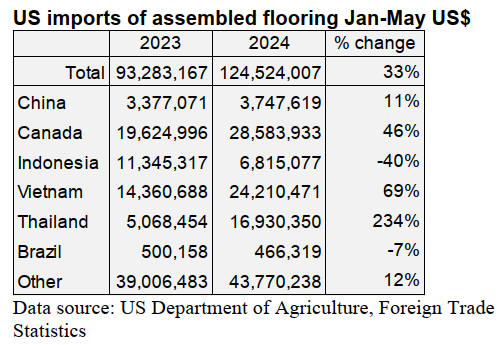
The value of imports of assembled flooring panels also
rose in May, gaining 10% over the previous month. The
May total was 38% above that of last May. Imports from
Thailand, Vietnam, and Canada all continued to
outperform the previous year by solid margins.
Imports from Brazil fell sharply in May and are now
behind last year’s pace, while imports from Indonesia slid
4% for the month and are now down 40% for the year so
far. Total imports of assembled flooring panels are up 33%
over last year through the first five months of the year.
Moulding imports gain 19%
US imports of hardwood mouldings rose 19% by value in
May as imports from top trading partners moved closer to
their 2023 averages. Imports from Malaysia surged 52%
while imports from Brazil and China both gained by more
than a third in May.
Imports from all three countries have been well below
their pace from last year. Imports from Canada slipped 3%
but remain ahead of last year by 4% through the first five
months of the year. Total imports for May were 8% better
that in May 2023 and imports are up 14% over 2023 year
to date.
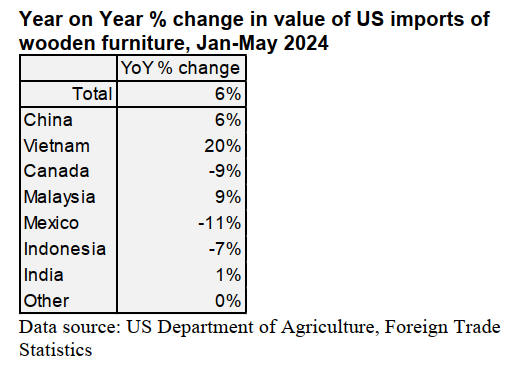
US wooden furniture imports hit 17-month high
US imports of wooden furniture grew by 15% in May,
rising to their highest level since December 2022. The
US$1.8 billion in imports for the month was 3% higher
than that of the previous May.
Imports from Vietnam jumped 32% to their highest level
since July 2022, while imports from China rose 23%.
Imports from Indonesia slipped 15% in May and are down
7% for the year so far. Total imports are up 6% over last
year through the first five months of the year.
As for the overall furniture market, Smith Leonard reports
that new orders were up 22% in April 2024 compared to
April 2023 (which was down 19% from April 2022),
continuing a streak of 10 out of the last 11 months with
overall order growth over the prior year.
While the elevated percentage would appear to be a bit of
an outlier compared to recent months, year to date through
April 2024, new orders are up 8% compared to 2023.
However, new orders were flat compared to the prior
month of March 2024.
Shipments appear to have begun normalizing compared to
last year, with April 2024 up 2% from April 2023, but
down 1% from March 2024. Year to date through April
2024, shipments are down 9% compared to 2023.
See: https://www.smith-leonard.com/2024/06/03/may-2024-
furniture-insights/
and
https://www.woodworkingnetwork.com/furniture/residential-
furniture-streak-continues-april-orders-rise-smith-leonard
Cabinet sales improved in May
US sales of cabinets in May rose 3.2% over the previous
month, according to the Kitchen Cabinet Makers
Association (KCMA). The US$253 million in May sales
from KCMA survey participants came in at 5.6% higher
than May of 2023.
Custom sales were up 7.2% over last May and 3.7% over
April’s figures. Semi-custom sales rose 6% over last May
and 4.7% over April. Stock sales were better than last May
by 2.5%, but down 1.9% from April. Year-to-date cabinet
sales are down 4.4% from last year through May.
See: https://kcma.org/insights/march-trend-business-report-0
Construction-cost increases moderate
US construction cost increases have returned to normal, a
multi-national construction company executive stated in a
quarterly trends report.
“Annual escalation trends have returned to the pre-
pandemic norm of 2% to 4%,” Steve Stouthamer,
executive vice president for Skanska USA, wrote in the
company’s report. “As we approach summer, it is a
welcome relief to share that we expect this trend to
continue.”
Costs of construction materials peaked in May 2022,
according to federal data. After a brief jump in February,
the past three months have seen steady declines. The
biggest change for contractors is greater predictability,
said Brandon Huff, vice president and division manager
for general construction at Deacon Construction in
Portland.
“I would say material pricing is holding,” Huff said in an
interview. “I don’t necessarily see it dropping too much.
It’s more consistent.” He added that during pandemic
disruptions, prices from subcontractors could change on a
near-daily basis, a practice which, thankfully, he no longer
sees happening.
“Declines in commercial office and privately financed
development projects are being offset by public
infrastructure projects, technology/data center projects,
continued primary and secondary educational spending
and health care project investments,” Stouthamer stated.
The cost of concrete is up 22.1% over the past 12 months,
and by 4.9% in the past three months. The cost of drywall
is up 16% for the year. Wall insulation has dropped 15%.
Lumber cost “continues to bounce around at the bottom of
the market,” due to oversupply and a slow housing market,
Skanska stated in its quarterly report.
See: https://dailyreporter.com/2024/06/24/report-construction-
cost-increases-moderate-to-pre-pandemic-levels/
|