|
Report from
Europe
Imports from tropical countries shifting away from
primary wood products
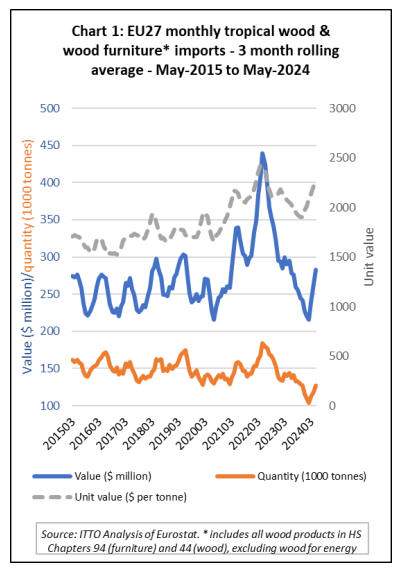
Total EU27 imports of tropical wood and wooden
furniture of 598,500 tonnes in the first five months of this
year were 16% down compared to the same period last
year. In value terms, EU27 imports were down 12% to
US$1296 million during the five-month period.
After falling to the lowest levels ever recorded in the first
quarter this year, EU27 imports of tropical products
recovered some ground in April and May. Import value
during those two months was back to the level typical
before the COVID pandemic, although import quantity
was still below that level.
Most of the recovery in EU27 imports of tropical wood
products in April and May this year was due to furniture
products. Imports of primary and secondary processed
tropical wood products remained at a very low ebb during
this period. This shift in the balance of imports from lesser
processed to more processed products has contributed a
significant rise in the unit value of tropical wood products
imported into the EU27 so far this year.
The average unit value of EU27 tropical wood product
imports was around US$2250 per tonne in the three
months to May 2024, not far short of the all-time high of
US$2450 per tonne during the pandemic and well above
average values of around US$1750 per tonne prevailing
before the pandemic (Chart 1).
Signs that EU economic recovery may be stalling
After economic stagnation in 2023, the EU economy
seemed to be recovering well in the first quarter of this
year.
But less encouraging data from the EU manufacturing
sector in the second quarter has since dampened
expectations of a swift rebound and led to more soul
searching about the global competitiveness of EU
industry.
According to Eurostat, seasonally adjusted GDP increased
by 0.3% in the EU in the first quarter of 2024 compared
with the previous quarter. Compared with the same quarter
of the previous year, seasonally adjusted GDP increased
by 0.6% in the EU in the first quarter of 2024.
However, manufacturing in Europe’s industrial heartland
has continued to weaken this year. Eurostat's industrial
production index for the eurozone remains below its 2021
level and it is currently trending lower. S&P Global’s
eurozone manufacturing purchasing managers index
(PMI), a rough real-time proxy for activity in the sector,
fell to a seven-month low of 45.6 in July.
In Germany the indicator came in at 42.6, a three-month
low, while in France it fell for a second straight month to
44.1. Anything under 50 is contractionary territory.
As for construction, the HCOB Eurozone Construction
PMI dropped to 41.8 in June from 42.9 in May, signalling
a marked contraction in output across the sector.
Construction production levels continued to fall across all
three of the major eurozone countries in June.
German firms faced the greatest slump in performance,
despite the contraction in output easing to the least marked
since August 2023. At the same time, faster reductions
were observed in the French and Italian construction
sectors, with the former seeing its sharpest fall in output
since March, and the latter posting its strongest drop in
nearly two years.
S&P’s composite PMI, which includes services, stayed
just above 50 in July, despite slowing from June. Overall,
the signs are that the EU’s economic development is
increasingly reliant on services while the situation of
industry remains gloomy.
The numbers underline the challenge faced by EU policy
makers in maintaining Europe’s competitiveness in the
global marketplace. The newly re-elected chief of the
European Commission, Ursula von der Leyen, put
restoring competitiveness front and centre in her political
priorities for her next mandate, while European Central
Bank President Christine Lagarde said in mid-July that
Europe’s competitive position vis-à-vis China is set to
have a growing influence on the Bank’s thinking.
A long-awaited report by former ECB president Mario
Draghi, now due in September, is expected to provide
more detail, and help set the EU’s economic agenda in the
next few years. In a recent speech in Spain, Draghi
underscored the importance of cheaper energy and
innovation as drivers of economic growth and increased
productivity.
He also noted that “successive layers of regulation have
created a burden on long-term investment”. While stating
that “we don’t want to become protectionist in Europe”, he
went on to suggest that “we cannot be passive if the
actions of others are threatening our prosperity” and
appeared to allow greater scope for state-driven
investment and trade protection measures.
See https://geopolitique.eu/en/2024/06/14/mario-draghi-grand-
continent-an-industrial-strategy-for-europe/
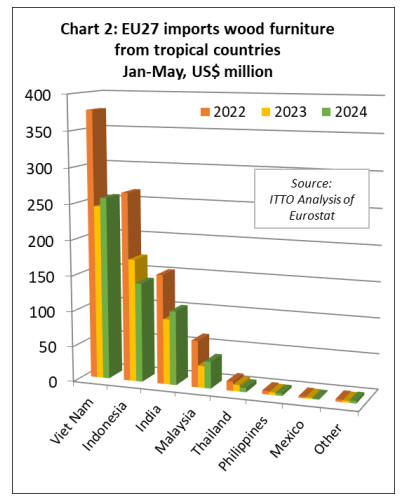
EU27 tropical wooden furniture imports rise after a
slow start to the year
The EU27 imported 131,600 tonnes of wooden furniture
from tropical countries with a total value of US$553
million in the first five months of 2024. Tonnage was up
7% while value was down 1% compared to the same
period in 2023. EU imports of tropical wooden furniture
picked up a bit in April and May after a very slow start to
the year.
In the first five months of this year compared to the same
period in 2023, EU27 import value of wooden furniture
increased from Vietnam (+5% to US$256.7 million), India
(+13% to US$104.2 million) and Malaysia (+23% to
US$37.9 million). However, import value declined from
Indonesia (-19% to US$139.8 million) and Thailand (-
33% to US$6.1 million). Imports from all other tropical
countries were negligible during the period (Chart 2).
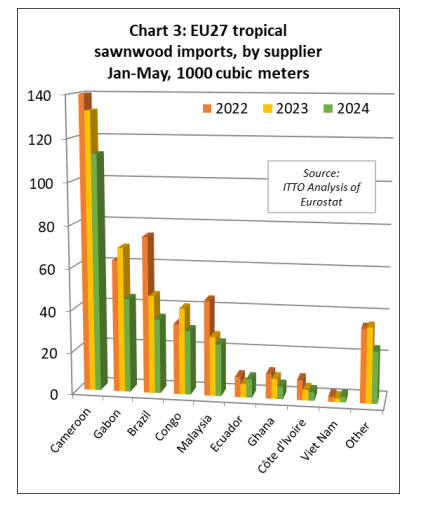
EU27 imports of tropical sawnwood at a low ebb this
year
The EU27 imported 294,200 cu.m. of tropical sawnwood
in the first five months this year, 22% less than the same
period in 2023. Import value of this commodity was
US$270 million in the first five months this year, 23% less
than the same period in 2023.
Imports declined from all leading supply countries during
the period including Cameroon (-15% to 112,600 cu.m.),
Gabon (-35% to 44,700 cu.m.), Republic of Congo (-26%
to 30,600 cu.m.), Brazil (-24% to 35,600 cu.m.), Malaysia
(-12% to 24,700 cu.m.), Ghana (-37% to 5,900 cu.m.),
Côte d’Ivoire (-19% to 4,000 cu.m.), and the Central
African Republic (-52% to 2,600 cu.m.).
However, imports increased from Ecuador (+41% to 8,800
cu.m.) and Vietnam (+66% to 2,700 cu.m.) (Chart 3).
The EU27 imported 53,000 tonnes of tropical
mouldings/decking in the first five months of this year,
14% less than in the same period in 2023. Import value of
this commodity was down 22% to US$93 million in the
same period. (Chart 4).
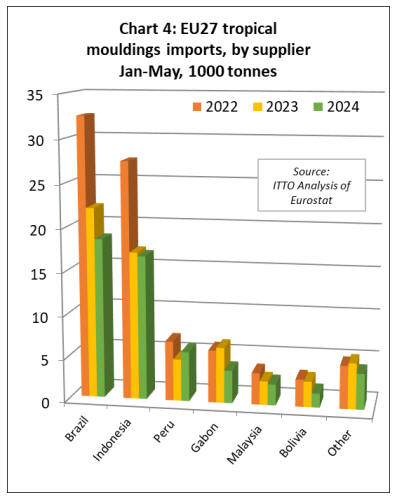
During the first five months imports increased year-on-
year from Peru (+19% to 5,800 tonnes) but fell from all
other leading supply countries including Brazil (-16% to
18,500 tonnes), Indonesia (-2% to 16,700 tonnes), Gabon
(-41% to 3,800 tonnes), Malaysia (-11% to 2,400 tonnes),
and Bolivia (-45% to 1,600 tonnes.
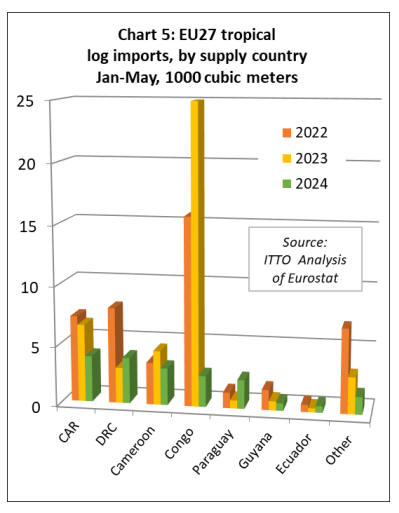
The EU27 imported 18,400 cu.m. of tropical logs with a
total value of US$10.9 million in the first five months of
this year, respectively 58% and 61% less than in the same
period last year. The decline was driven mainly by an 90%
decline in imports from the Republic of Congo to 2,600
cubic metres. This follows the ban on exports of most logs
from the country since 1st January 2023.
EU27 imports of logs in the first five months of this year
were also down compared to the same period last year
from the Central African Republic (-41% to 3,900 cubic
metres), Cameroon (-32% to 3,100 cubic metres), and
Guyana (-19% to 600 cubic metres).
However, EU27 log imports increased from the
Democratic Republic of Congo (+29% to 3,800 cubic
metres), Paraguay (+260% to 2,400 cubic metres), and
Ecuador (+65% to 500 cubic metres) during the five-
month period (Chart 5).
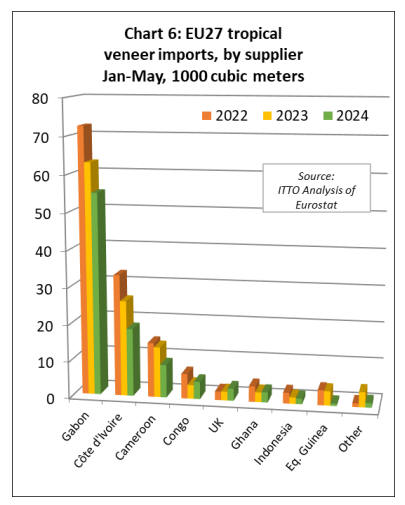
EU27 imports of tropical hardwood veneer down 20%
in January to May period
The EU27 imported 96,400 cu.m. of tropical veneer with a
total value of US$65 million in the first five months of this
year, down 20% and 21% respectively compared to the
same period last year.
Imports of tropical veneer from Gabon, by far the largest
supplier to the EU27, were 54,900 cu.m. in the first five
months of this year, 13% less than the same period in
2023.
EU27 imports of this commodity also decreased during the
period from Côte d'Ivoire (-29% to 18,400 cu.m.),
Cameroon (-35% to 8,900 cu.m.), Indonesia (-14% to
1,500 cu.m.), and Equatorial Guinea (-84% to 600 cu.m.).
However, imports increased during the period from the
Republic of Congo (+25% to 4,700 cu.m.), the UK (+37%
to 3,300 cu.m.), and Ghana (+5% to 2,800 cu.m.) (Chart
6).
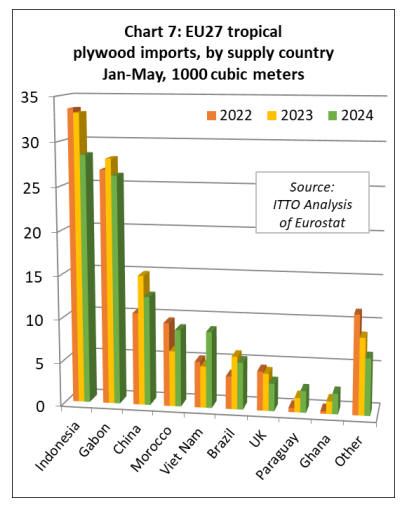
The EU27 imported 105,000 cu.m. of tropical plywood
with a total value of US$78 million in the first five months
of this year, respectively 4% and 7% less than the same
period last year.
Imports fell from all the leading supply countries during
the period including Indonesia (-14% to 28,500 cu.m.),
Gabon (-7% to 26,200 cu.m.), and China (-16% to 12,600
cu.m.).
Imports from Brazil were also down, by 11% to 5,400
cu.m., while indirect imports from the UK fell 26% to
3,200 cu.m. These losses were partly offset by rising
imports from Morocco (+39% to 8,900 cu.m.), Vietnam
(+84% to 8,800 cu.m.), Paraguay (+49% to 2,500 cu.m.),
and Ghana (+63% to 2,400 cu.m.) (Chart 7).
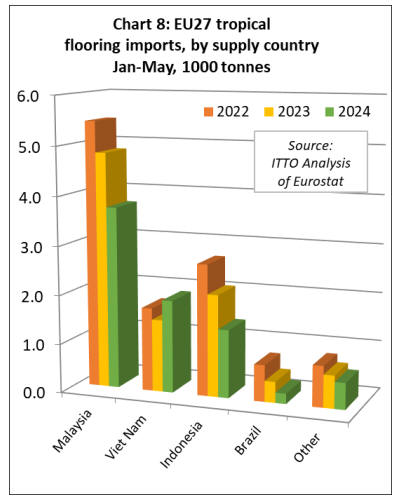
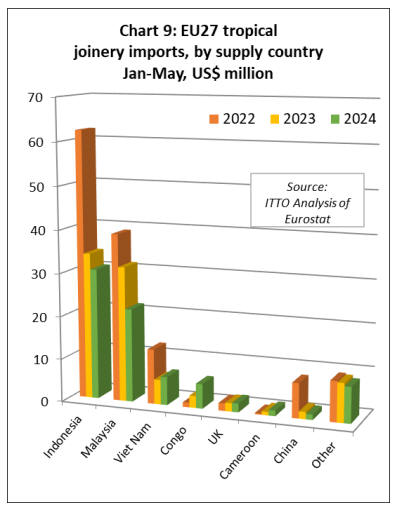
EU27 tropical wood joinery imports still very slow
The EU27 imported 7,800 tonnes of tropical wood
flooring with a total value of US$20 million in the first
five months of this year, down 18% and 27% respectively
compared to the same period in 2023.
Imports of 3,700 tonnes from Malaysia in the five-month
period this year were 23% less than the same period last
year. Imports also fell from Indonesia (-33% to 1,400
tonnes) and Brazil (-51% to 200 tonnes). However,
flooring imports from Vietnam increased by 28% to 1,900
tonnes during the period (Chart 8).
The value of EU27 imports of other joinery products from
tropical countries - which mainly comprise laminated
window scantlings, kitchen tops and wood doors – was
US$77 million in the first five months this year, down
12% compared to the same period in 2023. Import
quantity fell 2% to 33,900 tonnes during the same period.
Imports were down 11% to US$30.4 million from
Indonesia, down 31% to US$21.7 million from Malaysia,
and down 25% to US$1.2 million from China.
Of all Asian countries, only Vietnam increased exports of
joinery products to the EU in the first five months of this
year, by 13% to US$6.5 million.
With on-going efforts in the Republic of Congo to shift up
the value chain as log exports are banned, EU imports of
laminated joinery products from the country were valued
at US$5.7 million in the first five months of this year, up
106% compared to the same period last year.
Imports of these products also increased from Cameroon
in the first five months of this year, by 57% to US$1.3
million. (Chart 9).
Further calls to delay EU Deforestation Regulation
Pressure on the EU to delay implementation of the EU
Deforestation Regulation (EUDR) has continued to mount
from commodity producing countries worldwide
according to leading international media.
Most recently, supplier country governments have
questioned the accuracy of, and definitions used in
mapping undertaken for EUDR enforcement by the EU
Observatory to identify areas of deforested and degraded
forest land.
The EUDR is set to come into force at the end of 2024. It
will require all operators and non-SME traders to
undertake due diligence to ensure no timber and six other
so-called forest and eco-risk commodities (FERCs) that
are placed on or exported from the EU market are
implicated in deforestation or forest degradation that has
taken place since 2020. It also stipulates that businesses
must provide the geolocation coordinates of the plot of
land from which commodities originate. The Regulation
will extend to SME traders six months later.
Australia and Brazil are ‘stepping up demands for the
[EUDR] to be delayed’, according to a report by the
Financial Times (FT). Their latest contention is that the
mapping undertaken by the European Observatory to
identify deforested and degraded forest land, and which
will be one of the pillars of EUDR enforcement, cannot be
taken as definitive.
“The EU’s map is not a single source of truth but acts as
one possible source of information for EU operators and
competent authorities to determine if deforestation has
occurred,” a spokesperson for the Australian embassy in
Brussels told the FT.
The Australians point out that there are differences
between their 2023 Forests of Australia map and that of
the European Observatory as they use different definitions
of forested areas.
Pedro Miguel da Costa e Silva, Brazil’s EU ambassador,
also picked up this theme. He said the Brazilian private
sector had identified multiple cases of cocoa, coffee and
tree plantations that have been misidentified as forests in
the European Observatory mapping. Canada and
Columbia have also questioned the validity of the
mapping.
“European operators and competent authorities should co-
operate with producer governments to use local
monitoring systems that have much higher precision
rates,” Da Costa e Silva told the FT. He added that Brazil
has a free-to-use ‘state of the art’ monitoring system. He
said the EU was imposing European standards and norms
on other countries without collaboration and that
producers would have to spend millions of euros on
private sector compliance systems.
Columbia’s Institute of Hydrology, Meteorology and
Environmental Studies said its deforestation mapping was
similar to the EUs, but the latter’s definition “would also
include areas not considered as deforestation in Colombia,
for example conversion of areas of secondary vegetation”.
The Australian embassy in Brussels also highlighted that
clarification is needed from the EU on what constitutes
‘predominantly agricultural land use’ under the EUDR. It
said it had requested a delay in introduction of the
Regulation ‘until all required arrangements are understood
and effectively in place’, pointing out that several EU
member states had not yet appointed Competent
Authorities to police the new rules.
On the issue of mapping, the EC has emphasised that the
European Observatory maps were ‘a tool to help
companies to ensure compliance’. They were not
mandatory, and other ‘more granular or detailed’
information could be used as a guide.
An article in The Economist titled ‘How EU do-goodery
risks harming Africa’s small farmer’ focuses on the
challenges posed by EUDR to the African coffee industry.
It quotes representatives of the Ethiopian and Ugandan
sectors saying that they were struggling to provide
geolocation coordinates for the millions of plots of land
where coffee was grown for the EU market. Adding to the
complexity of the situation, the African supply chains in
coffee and cocoa (another commodity covered by the
EUDR) are highly complex, pooling and mixing beans
from multiple sources.
Enveritas, a sustainability assurance specialist, is putting
forward an alternative approach, using satellite imagery to
identify fields here trees have been cut down, without
requiring geo-locating every farm. The Economist report
Ethiopia and Uganda backing this model. The question is
whether the EU will accept it.
The FT reported that the then Environment Commissioner
Virginijus Sinkevičius said there were no plans to delay
implementation of the EUDR. He has since resigned to
take up a seat in the European parliament. The
Environment role has been temporarily taken over by
Maroš Šefčovič, Executive Vice-President of the EC for
European Green Deal.
In another FT article, Senior Trade Correspondent Alan
Beattie said that ‘irritation’ with the EUDR within the EC
has ‘now broken into the open’. It quotes Sabine Weyand,
director-general of the trade directorate, as saying; “I think
we have to recognise that we have pushed away a number
of partners we need through our increased use of
autonomous trade measures. We hear that increasingly on
measures like the deforestation regulation.”
She suggests widening EU support to the developing
world, including via its ‘Global Gateway’, strategy for
increasing investment, particularly for the climate
transition and especially in Africa.
The article also quotes Odrek Rwabwogo, senior adviser
to the president of Uganda on trade. He urged more
support for Uganda’s wish to move up the value chain into
further processing, rather than stay an exporter of
unprocessed commodities and, for instance, roast coffee
in-country rather than use more land simply to expand the
production of low-value green coffee beans. “[But] our
conversations with Europe are not on the level we would
like,” he said. “We want them to be about growth, but they
are just about compliance.”
The FT article concludes that a delay in introducing the
EUDR ‘seems wise’.
“But the EU should use the time not just to iron out the
obvious compliance wrinkles, but to give some thought to
how climate, trade and development policies might be
combined into a more coherent strategy,” it says.
Sources:
https://www.ft.com/content/8dab4dc6-197b-4a2f-86f0-
d5e83ce00b09
https://www.ft.com/content/ab2aabbc-8978-444b-844b-
3d0d70553266
https://www.ft.com/content/03ce886b-c110-45fd-bc56-
0254daa75969
https://www.economist.com/middle-east-and-
africa/2024/07/04/how-eu-do-goodery-risks-harming-africas-
small-farmers
EU implements eco-design regulation
A new regulation setting out to make sustainable products
the norm in the EU market has implications for
manufacturers, importers, distributors, retailers and sellers
worldwide, according to a report from
www.sustainablebrands.com. The new Ecodesign for
Sustainable Products Regulation (ESPR) came into force
in July and, says the article, sets out environmental design
requirements for almost all products, with a few
exceptions, including food and medicines.
“We’re setting the bar higher to ensure that resource- and
energy-efficient products become the norm on the EU
market,” Maroš Šefčovič, Executive VP for the European
Green Deal is quoted as saying.
The idea, says Sustainable Brands, is to ‘make sure the
products being put on the market are easier to repair,
recycle and reuse as part of a circular economy’.
“According to policymakers, around 80% of a product’s
environmental impact is determined by how it is
designed,” it says. “The legislation includes criteria
centred on improving product durability, reducing energy
consumption, increasing recycled content, facilitating
remanufacture and recycling, and increasing the
availability of information on just how sustainable a
product might be.”
The European Commission is set to adopt the first working
plan for the ESPR, outlining the initial set of products for
which eco-design requirements will be developed, in
March 2025. These will then be adopted towards the end
of 2026 and will apply from 2027 onward. The
preliminary list of products the legislation will cover first
includes furniture and textiles. The ESPR also introduces
the concept of a Digital Product Passport, likely to be a
QR code linked to a database, to give consumers
information about the journey of a product to market.
See: https://sustainablebrands.com/read/espr-sustainable-
products-norm-eu-consumers
and
https://commission.europa.eu/energy-climate-change-
environment/standards-tools-and-labels/products-labelling-rules-
and-requirements/sustainable-products/ecodesign-sustainable-
products-regulation_en
|