|
Report from
Europe
EU tropical wood import quantity heading for an
historic low
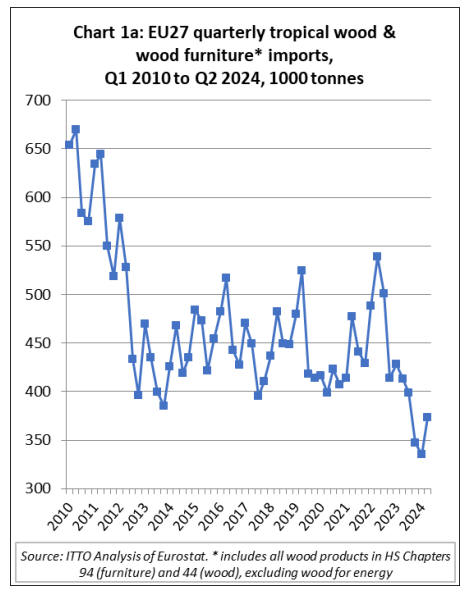
Total EU27 imports of tropical wood and wood furniture
of 373,500 tonnes in the second quarter of this year were
up 11% compared to the previous quarter but 10% less
than in the same quarter last year.
Although an improvement on the previous two quarters,
the second quarter figures remained well below the long-
term average (Chart 1a). In the first six months of 2024,
the EU27 imported 708,700 tonnes of tropical wood and
wood furniture, 16% less than the same period in 2023.
There are ominous signs that, in quantity terms, EU
imports of tropical wood and wood furniture products this
year may hit the lowest annual level ever recorded since
the EU was first formed (as the EEC) in 1957.
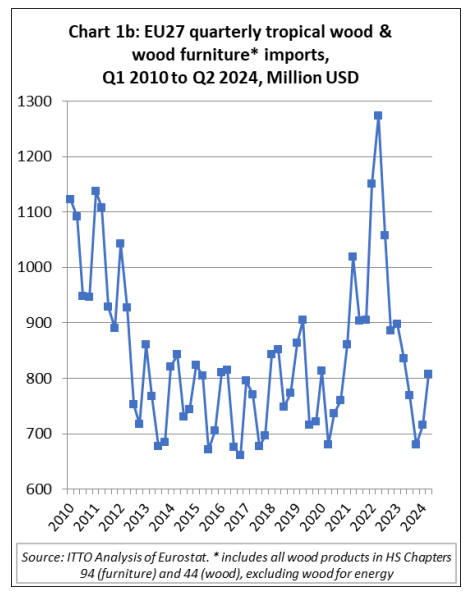
The trade figures look healthier when considered in value
terms. EU27 import value of tropical wood and wood
furniture in the second quarter this year was US$807
million, 13% more than the previous quarter and just 3%
down on the same quarter last year.
In value terms, EU27 tropical wood product imports are
similar to the low but stable level prevailing between 2013
and 2019 (Chart 1b). In the first six months of 2024, the
EU27 imported tropical wood and wood furniture with
total value of US$1523 million, 16% less than the same
period in 2023.
Soft landing for EU economy overall but construction
sector is very slow
The slow pace of tropical wood product imports into the
EU is occurring against the background of subdued and
uncertain economic conditions in the region. At first sight,
the EU seems to have managed a soft landing this year
after the COVID-driven boom and bust cycle that
characterised the previous three years.
The latest data from Eurostat indicates that seasonally
adjusted GDP in the EU in the second quarter of 2024 was
up 0.3% compared to the previous quarter. This followed
an equivalent 0.3% increase in the first quarter of the year.
Two consecutive quarters of solid, if unexciting, growth is
a relief after more than a year of stagnation.
GDP increased in the 2nd quarter of 2024 in seventeen EU
countries, remained stable in one and decreased in four
(2nd quarter data are not available for 5 countries at the
time of writing). Poland (up 1.5%) and Ireland (up 1.2%)
recorded the largest GDP increases.
There is also good news on employment, which is
growing, albeit more slowly than before. Wage growth is
outpacing inflation, too, leading to rising living standards.
Notwithstanding continuing concerns around inflation, the
European Central Bank felt confident enough to cut
interest rates in June and is expected to do so again in
September.
However, other aspects of the EU economy are more
problematic. A recent article in the Economist notes that
growth in incomes is not boosting consumption as much as
expected, noting that “households are mostly putting the
additional money from higher pay into their savings
accounts”, a sign of low consumer confidence. Eurostat
data confirms this. Following a dramatic fall in summer
2022, economic sentiment in the EU has been flatlining
for the last two years.
Following heavy expenditure on COVID recovery
measures between 2020 and 2023, European Governments
now have little room to support demand with extra
spending of their own. They are now more inclined to cut
expenditure to balance the books and meet EC
requirements to reduce deficits. According to the
Economist “fiscal policy will be a drag on EU growth in
the years to come”.
Much concern around the EU economy is now focused on
one country, Germany, traditionally the region’s industrial
powerhouse. Germany’s GDP declined by 0.1% in the
second quarter this year after achieving only 0.2% growth
in the first quarter. In fact, the German economy has
barely grown since 2019. Industrial production in the EU
was sliding in May and June, with Germany the principal
source of weakness.
Germany’s exports fell by 4.4% in June, compared with a
year earlier, and surveys indicate that worse is to come.
Germany’s car industry, globally dominant for so long, is
now coming under pressure as low-cost electric vehicles
(EVs) pour out of China’s factories. This is creating trade
tensions as China prepares to sue the EU at the World
Trade Organisation for raising tariffs on EVs.
The weakness of the EU construction sector is a particular
concern for the EU’s timber industry. Although Eurostat
data shows that the seasonally adjusted value of
construction activity in the EU increased by 1.1% in June,
this followed a long decline. Construction activity in May
was at the lowest level since December 2022.
Forward-looking indices suggest that EU construction
activity has continued to weaken. In August, the HCOB
Eurozone Construction PMI Total Activity Index - a
seasonally adjusted index tracking monthly changes in
total industry activity - was unchanged from July's six-
month low of 41.4, signalling a steep reduction in total
construction activity across the euro area. According to
this index, activity has now fallen in each of the last 28
months.
According to the HCOB PMI, the overall reduction in
construction activity in August reflected declines across
the three largest eurozone economies during the month.
Activity in Germany decreased at the sharpest rate in three
months, while there were slightly softer contractions in
France and Italy. The contraction was also broad based
across the three monitored segments of construction -
housing, commercial, and civil engineering – although it
was more pronounced in housing than the other sectors.
EU27 tropical wooden furniture imports make up for
some lost ground in Q2 2024
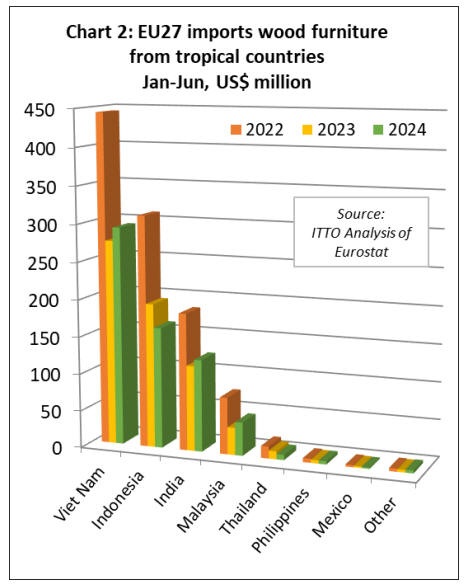
After a very slow start to the year, EU wooden furniture
imports from tropical countries made up for some lost
ground in the second quarter. In the first six months of the
year, the EU27 imported 153,200 tonnes of wooden
furniture from tropical countries with a total value of
US$641 million.
Import quantity was down 7% but import value was
unchanged compared to the same period in 2023. In the
first six months of this year compared to the same period
in 2023, EU27 import value of wood furniture increased
from Vietnam (+7% to US$293.3 million), India (+8% to
US$123.7 million), and Malaysia (+22% to US$44.6
million).
However, import value fell from Indonesia (-16% to
US$162.5 million), Thailand (-34% to US$7.1 million),
the Philippines (-1% to US$4.4 million), and Mexico (-
20% to US$1.7 million). EU27 wood furniture imports
from all other tropical countries were negligible during the
period (Chart 2).
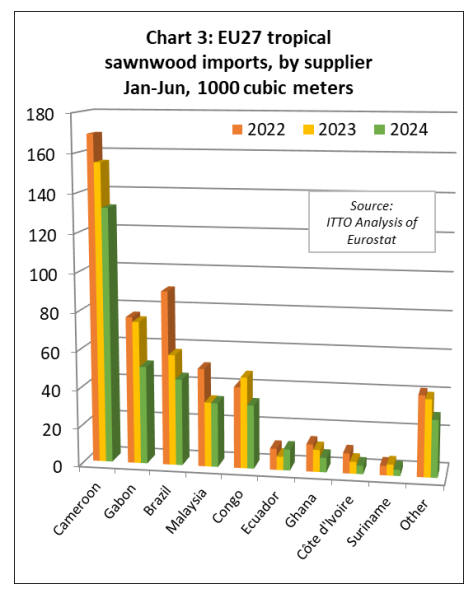
EU27 imports of tropical sawnwood down 20% in the
first half of 2024
The EU27 imported 350,500 cu.m of tropical sawnwood
in the first six months of this year, 20% less than the same
period in 2023.
Import value of this commodity was US$322.5 million in
the January to June period this year, 21% less than the
same period in 2023.
Imports declined from nearly all leading supply countries
during the period including Cameroon (-15% to 132,100
cu.m), Gabon (-31% to 50,800 cu.m), Brazil (-22% to
45,000 cu.m), Malaysia (-1% to 33,400 cu.m), Republic of
Congo (-30% to 33,100 cu.m), Ghana (-34% to 7,600
cu.m), Côte d’Ivoire (-30% to 4,400 cu.m), Suriname (-
43% to 3,300 cu.m) and the Central African Republic (-
54% to 3,100 cu.m).
Sawnwood imports from Ecuador bucked the overall
downward trend in the first half of this year, at 11,000
cu.m, up 57% compared to the same period in 2023 (Chart
3).
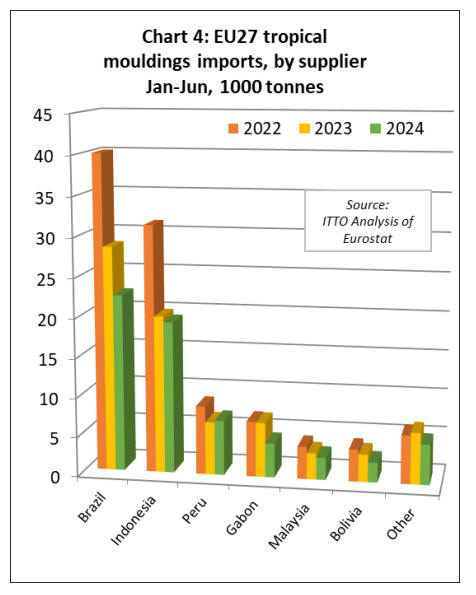
The EU27 imported 63,300 tonnes of tropical
mouldings/decking in the first six months of this year,
16% less than in the same period in 2023.
Import value of this commodity was down 24% to
US$110.6 million in the same period. During the first six
months, imports increased year-on-year from Peru (+4%
to 6,900 tonnes) but fell from all other leading supply
countries including Brazil (-21% to 22,400 tonnes),
Indonesia (-4% to 19,200 tonnes), Gabon (-37% to 4,300
tonnes), Malaysia (-16% to 2,800 tonnes), and Bolivia (-
28% to 2,500 tonnes) (Chart 4).
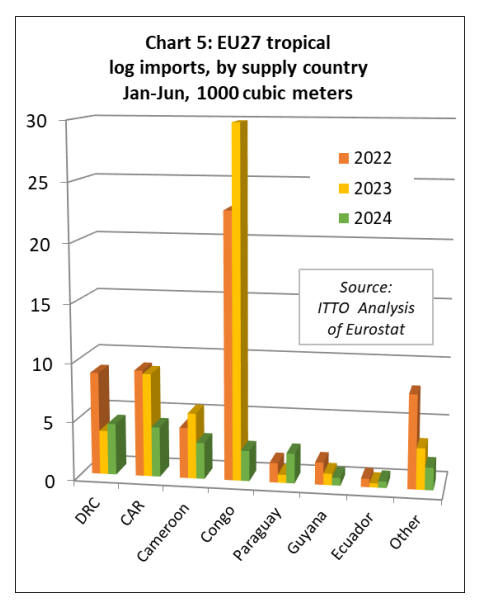
The EU27 imported 20,000 cu.m of tropical logs with a
total value of US$18.3 million in the first six months of
this year, respectively 63% and 65% less than in the same
period last year. The decline was driven mainly by an 91%
decline in imports from the Republic of Congo to 2,600
cu.m. This follows the ban on exports of most logs from
the country since 1st January 2023.
EU27 imports of logs in the first quarter of this year were
also down compared to the same period last year from the
Central African Republic (-52% to 4,300 cu.m), Cameroon
(-45% to 3,100 cu.m), and Guyana (-32% to 700 cu.m).
However, EU27 log imports increased from the
Democratic Republic of Congo (+17% to 4,400 cu.m),
Paraguay (+267% to 2,500 cu.m), and Ecuador (+54% to
500 cu.m) during the six-month period (Chart 5).
EU27 imports of tropical hardwood veneer, plywood
and joinery decline sharply
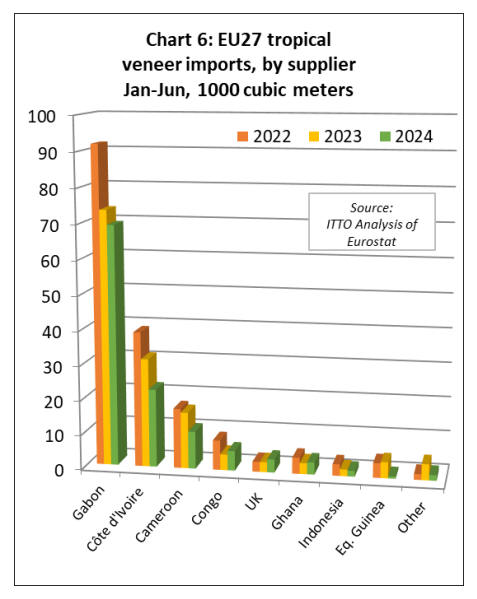
The EU27 imported 119,400 cu.m of tropical veneer with
a total value of US$80.5 million in the first six months of
this year, down 16% and 18% respectively compared to
the same period last year. Imports of tropical veneer from
Gabon, by far the largest supplier to the EU27, were
69,300 cu.m in the first six months of this year, 6% less
than the same period in 2023.
EU27 imports of this commodity also decreased during the
period from Côte d'Ivoire (-28% to 22,500 cu.m),
Cameroon (-34% to 10,800 cu.m), Indonesia (-15% to
1,600 cu.m), and Equatorial Guinea (-87% to 600 cu.m).
Veneer imports into the EU27 increased during the six-
month period from the Republic of Congo (+24% to 5,700
cu.m), the UK (+30% to 3,800 cu.m), and Ghana (+11% to
3,500 cu.m). (Chart 6).
The EU27 imported 126,000 cu.m of tropical plywood
with a total value of US$91.5 million in the first six-
months of this year, respectively 7% and 10% less than the
same period last year.
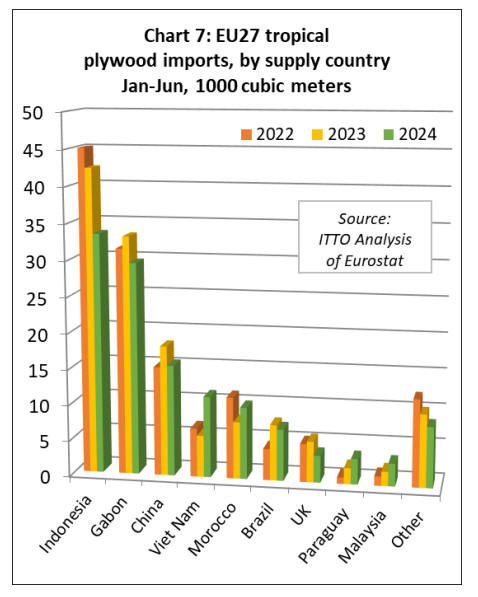
Imports fell from the three leading supply countries during
the period including Indonesia (-21% to 33,400 cu.m),
Gabon (-11% to 29,600 cu.m), and China (-15% to 15,500
cu.m).
Imports from Brazil were also down, by 7% to 7,200 cu.m,
while indirect imports via the UK fell 34% to 3,800 cu.m.
However, these losses during the six-month period were
partly offset by rising imports from Vietnam (+95% to
11,300 cu.m), Morocco (+26% to 10,000 cu.m), Paraguay
(+59% to 3,600 cu.m), and Malaysia (+58% to 3,200
cu.m) (Chart 7 left).
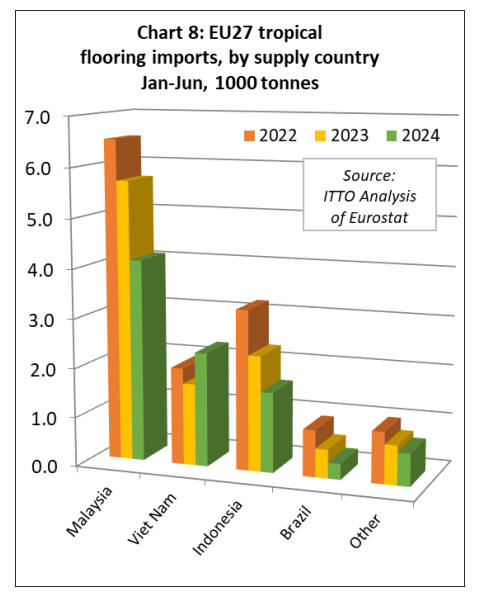
The EU27 imported 9,000 tonnes of tropical wood
flooring with a total value of US$23.1 million in the first
six months of this year, down 19% and 27% respectively
compared to the same period in 2023.
Imports of 4,100 tonnes from Malaysia in the first six-
months of this year were 28% less than the same period
last year. Flooring imports also fell from Indonesia (-39%
to 2,300 tonnes) and Brazil (-45% to 300 tonnes).
However, imports increased from Vietnam (+39% to 2,300
tonnes) (Chart 8).
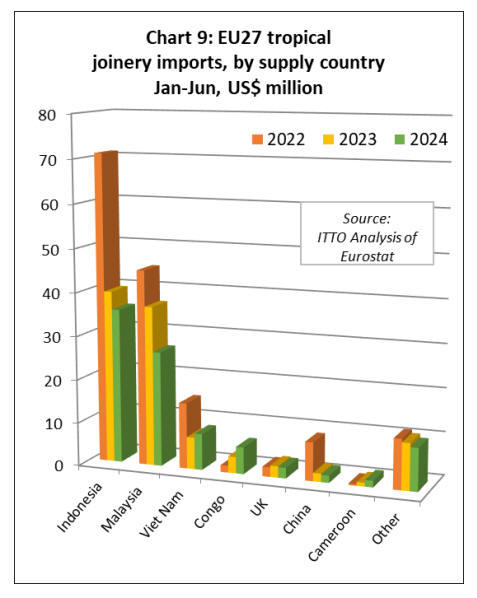
The value of EU27 imports of other joinery products from
tropical countries - which mainly comprise laminated
window scantlings, kitchen tops and wood doors – was
US$91.8 million in the first six-months of this year, down
11% compared to the same period in 2023. Import
quantity fell 2% to 40,700 tonnes during the same period.
Between January and June this year, EU27 import value of
other joinery products was down 10% to US$35.6 million
from Indonesia and down 28% to US$26.4 million from
Malaysia.
However, import value from Vietnam increased 13% to
US$8.3 million during the six-month period. In a
potentially significant longer-term development, given
efforts in central Africa to shift up the value chain as log
exports are banned.
EU import value of laminated joinery products in the first
six months of 2024 was up 62% to US$6.1 million from
the Republic of Congo and up 74% to US$1.5 million
from Cameroon (Chart 9).
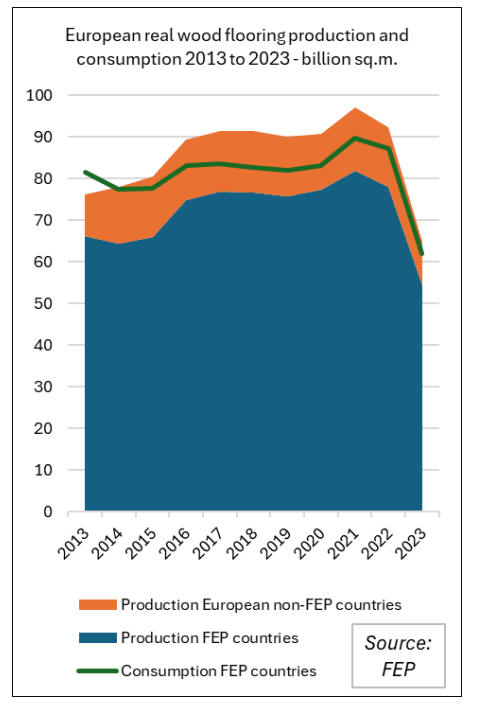
European parquet market hits bottom last year
According to data released by the European Parquet
Flooring Federation (FEP), after a good year in 2022
which consolidated the level reached during the boom in
2021, the European market for real wood flooring
experienced a significant 30.5% fall in 2023.
Decreases were observed in all European markets,
reflecting the decline in construction activity, high interest
rates, and lack of consumer confidence.
In 2023, real wood flooring production in FEP countries
fell by 30.5% in 2023 to 54.4 million square metres, while
consumption also fell by over 30% to 62 million sq.m.
FEP countries include Austria, Belgium, Croatia, Czechia,
Denmark, Estonia, Finland, France, Germany, Hungary,
Italy, Netherlands, Norway, Poland, Portugal, Romania,
Slovenia, Spain, Sweden, and Switzerland.
Real wood flooring production in European countries that
are not members of FEP is estimated to have reached 10.4
million sq.m. in 2023. This implies that total European
real wood flooring production fell nearly 30% to 64.74
million sq.m. last year.
In 2023, the proportion of real wood flooring production
in FEP countries by product type was largely unchanged
from that reported ever since 2010. Multilayer dominates
with 84% (compared to 83% in 2022), followed by solid at
14% (compared to 15% in 2022) and mosaic with a stable
2% of total production.
Oak is hugely dominant, with 83% of all real wood
flooring manufactured in FEP countries faced with this
species in 2023, up from 82% in 2022. 2% of real wood
flooring manufactured in the region comprised tropical
wood, although the category “other” at 3.2% may, partly,
be comprised of tropical wood. Ash and beech were two
other most common species, contributing 4.5% and 2.7%
respectively.
Poland remained the largest producer country, contributing
18% of total production in FEP countries, followed by
Austria (14%), and Sweden (12%).
Despite a decline in consumption last year, amongst FEP
countries Germany was the largest single market for real
wood flooring, accounting for 17% of total sales in the
region in 2023. The next largest markets were Italy (13%)
, Sweden (11%), and France (10%).
In terms of per capita real wood flooring consumption,
Austria, Switzerland, Estonia, Croatia, and Sweden are the
leading markets. Consumption per inhabitant fell
significantly in FEP member countries, from 0.20 sq.m. in
2022 to 0.14 sq.m. in 2023.
According to their mid-year forecast, FEP expect that the
year 2024 will be stable overall but at a low level of
consumption. The sector seems to have reached bottom
but may remain at this level for some time. Stocks are now
much lower and well balanced with demand, which is very
slow.
Delivery times in the European parquet industry have
returned to pre-Covid level. In general, the situation
remains difficult as interest rates are high and construction
activity is subdued. On 4 April this year, FEP lodged a
formal complaint with the EC on behalf of the EU
multilayered wood flooring industry alleging that EU
imports of this product originating in the People’s
Republic of China, are being dumped and “thereby
causing injury to the Union industry”.
The EC is investigating the complaint, the subject of
which is assembled flooring panels, multilayer, of wood,
currently falling under CN code 44187500. Panels of
bamboo or with at least the top layer (wear layer) of
bamboo, and panels for mosaic floors are excluded from
the complaint and the investigation.
See: https://www.parquet.net/2024/06/european-parquet-market-
bottom-2023.html
and
https://eur-lex.europa.eu/legal-
content/EN/TXT/HTML/?uri=OJ%3AC_202403186
|