|
Report from
North America
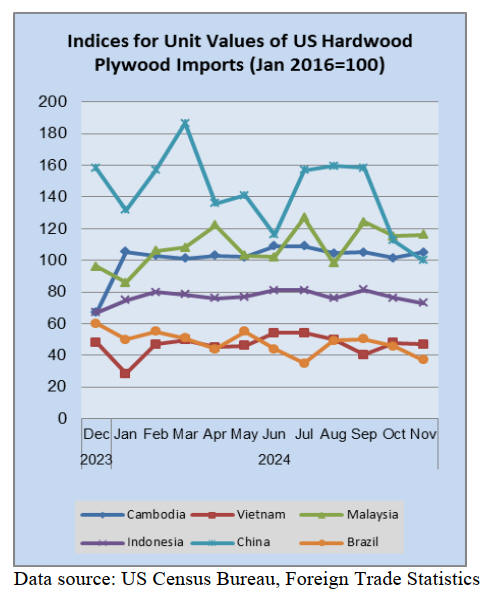
Hardwood plywood imports surge
US imports of hardwood plywood surged 21% in
November to their highest volume since January. The
255,173 cubic metres of plywood imported in November
was, however, 7% less than that of the previous November
Imports from several countries showed marked
improvement with imports from China up 51%, imports
from Malaysia up 40% and imports from Vietnam and
Indonesia both up 28%.
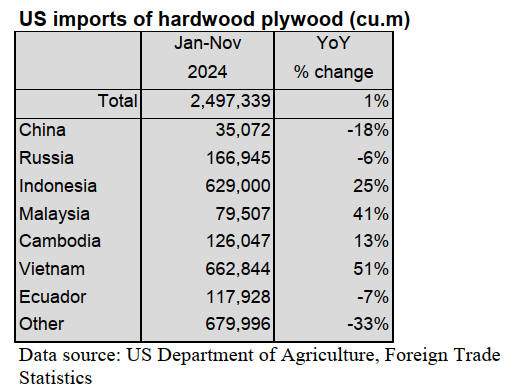
Indonesia and Vietnam are the top suppliers for the year
by far and imports from both countries grew sharply in
2024. Imports from Vietnam for the year to date are up
51% through November while imports from Indonesia are
up 25%. The total volume of US hardwood plywood
imports for 2024 is up 1% from last year as of November.
Sawn tropical hardwood imports rally
US imports of sawn tropical hardwood leapt 25% in
November, furthering a recovery from a weak autumn
market. The 17,038 cubic metres imported in November
accounted for the second-best volume month of the year
and was 42% higher than that of November 2023.
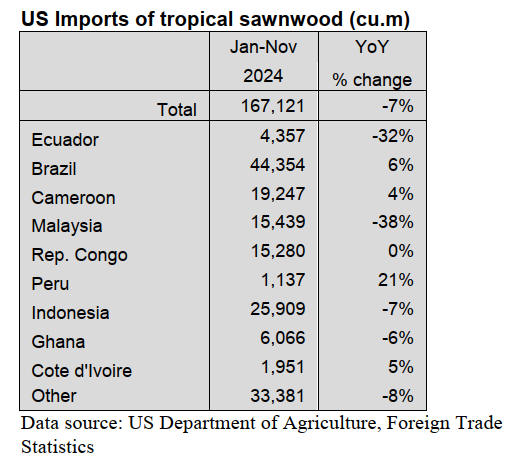
Imports from Brazil and Ghana both more than doubled
from the previous month while imports from Malaysia
rose 81%. Imports from Malaysia were their strongest this
year in November but have been lagging for most of 2023,
down 38% from last year for the year so far. Total US
imports of sawn tropical hardwood are down 7% versus
last year through November.
Canadian imports of sawn tropical hardwood fell 2% from
the previous month. Despite the slip, imports remain at a
high level and were 38% higher than those of November
2023.
A massive increase in imports from Congo (Brazzaville)
of 635% made up for significant drops in imports from
several countries including Brazil, Cameroon, Bolivia and
Malaysia. As of November, Canada’s total imports of
sawn tropical hardwood remain ahead of 2023 by 39%.
Veneer imports plunge
US imports of tropical hardwood veneer plunged 22% in
November to their lowest level since February. With the
drop, imports for November were 41% lower than in
November 2023.
Imports from Cote d’Ivoire fell 72% to a two-year low
while there were even steeper declines in imports from
Ghana (down 86%) and China (down 96%).
A 52% increase in imports from Cameroon helped
mitigate some of the loss. Total US imports of tropical
hardwood veneer were down 18% versus last year through
to November.
Hardwood flooring imports jump
US imports of hardwood flooring climbed 24% in
November on strong gains in imports from Malaysia and
Brazil. Imports for the month were 14% higher than the
previous November.
Imports from Brazil climbed 54% to their highest level
since 2021 while imports from Malaysia more than
doubled from the previous month. For the year so far,
imports from Brazil are more than double what they were
in 2023. Total imports of hardwood flooring for are down
11% year to date versus last year.
US imports of assembled flooring panels dropped 5% in
November but remain well ahead of last year’s pace. At
US$30.7 million, imports for November were a healthy
24% higher than the previous November.
Imports from China, Vietnam and Thailand all fell by
about 20% in November, while imports from Canada (up
7%) and Indonesia (up 11%) showed gains. Total US
imports of assembled flooring panels were up 36% over
last year through to November.
Moulding imports continue to slide
US imports of hardwood moulding fell for a second
straight month in November after reaching a two-year high
in September. Imports dipped 5% from October to
November but still held on to a level 34% higher than a
year ago.
A 9% drop in imports from leading trade partner Canada
fueled the slip while imports from Brazil remained weak.
Imports from China and Malaysia showed impressive
gains. Total US imports of hardwood molding remained
up 28% versus 2023 through November.
Wooden furniture imports falter
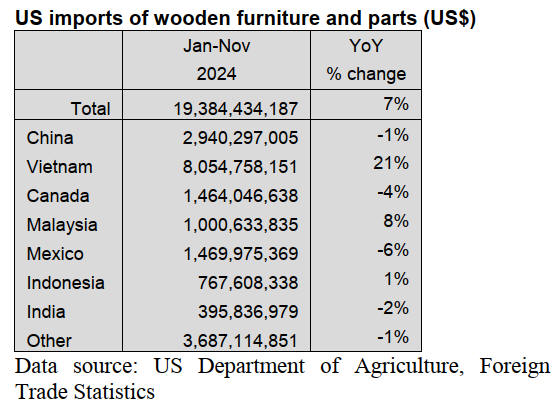
US imports of wooden furniture dropped 5% in November
after two months of solid gains. Despite the setback, at
US$1.8 billion, imports for the month were 6% higher
than the previous November total.
Apart from a small gain in imports from China, imports
fell from all major trading partners with imports dropping
12% from both Canada and Mexico and imports from
Indonesia falling 18%. Total imports of wooden furniture
for the year were ahead of 2023 by 7% through November.
October residential furniture orders flat, modest
optimism for 2025
New residential furniture orders were essentially flat in
October compared to 2023 figures, putting an end to five
straight months of year-on-year declines according to the
December issue of Furniture Insights.
However, new orders were down 2% compared to
September 2024 figures and were flat for the year-to-date
noted Mark Laferriere, assurance partner at Smith
Leonard, the accounting and consulting firm that produces
the monthly report. October shipments were down 5%
compared to 2023 figures, but up 4% from September
2024. Year to date through October 2024, shipments were
down 7% compared to 2023.
See: https://www.woodworkingnetwork.com/furniture/october-
residential-furniture-orders-flat-modest-optimism-2025
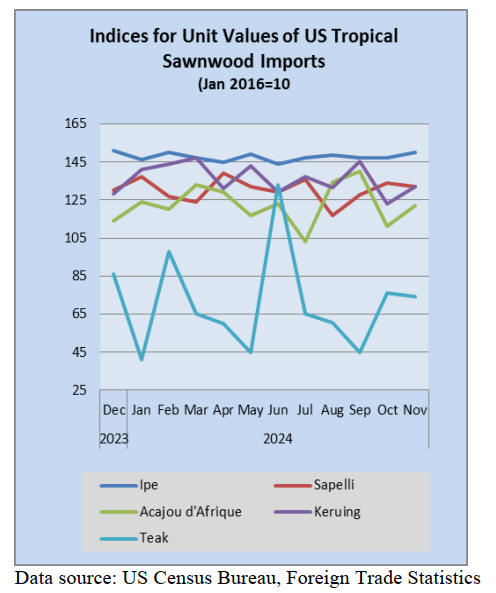
Note: the doubling of the unit value for teak may be a statistical
error. Use with caution.
|