|
Report from
Europe
EU tropical wood imports at a low ebb in the first
quarter of 2025
The EU27 imported 373,200 tonnes of tropical wood and
wooden furniture in the first quarter of 2025, 11% more
than the same quarter in 2024. This gain seems less
impressive when it is considered that EU imports were at
an all-time low at the start of 2024.
Imports in the first three months of this year were also
down 5% compared to the fourth quarter of 2024. Import
tonnage during the first three months of this year remained
well below quarterly trade figures typical during the pre-
pandemic 2013-2019 period.
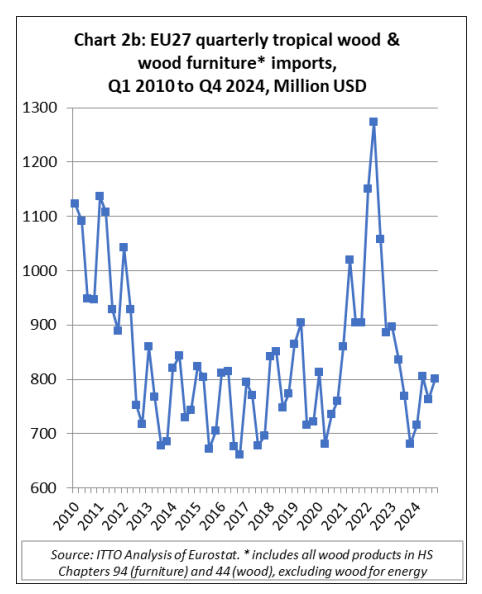
EU27 import value of tropical wood and wooden furniture
in the first quarter of 2025 was USD809 million, 1% more
than the previous quarter and 13% up on the same quarter
in 2024. In value terms, imports during the first quarter of
2025 were more closely aligned with those of the pre-
pandemic 2013-2019 period (Chart 2b).
Some slight signs of warming in the European
economy
The slow pace of EU tropical wood and wooden furniture
imports in the first quarter of 2025 is disappointing after
such a long period of low trade and at a time when there
were emerging signs of economic recovery in the region.
The European Commission Spring Forecast published on
19 May reveals that the EU economy grew by 0.4% in the
fourth quarter of last year, slightly surpassing the EC’s
autumn projections. For the whole of 2024, GDP growth
in the EU reached 1.0%.
The volume of government consumption expanded
vigorously and provided a larger-than-expected
contribution to EU growth at the end of last year, mainly
through employment growth in the government sector.
Growth in private consumption also exceeded expectations
towards the end of the year, driven by solid increases in
disposable income as the economy added over 1.7 million
jobs, and nominal wages recovered the purchasing power
lost to surging inflation. Net exports also bolstered EU
growth, buoyed by a robust rise in services exports. The
EU's economic expansion continued in the first quarter of
this year, with real GDP growth increasing by 0.3%.
The EC’s expectations for GDP growth in the EU during
the rest of this year are now tempered by the impact of
increased tariffs and the heightened uncertainty caused by
the recent abrupt changes in US trade policy and the
unpredictability of the tariffs’ final configuration. GDP
growth in the EU in 2025 is currently projected at 1.1%,
only a marginal gain compared to 2024 and representing a
considerable downgrade compared to the Autumn 2024
Forecast.
This forecast assumes that the high tariffs announced on 2
April will not be reinstated and that US tariffs on imports
from the EU and nearly all other countries will stay at 10%
(the level generally applied on 9 April), except for higher
tariffs on steel, aluminium, and cars (25%), and
exemptions on some products like pharmaceuticals and
microprocessors.
There is a much uncertainty around these assumptions at
time of writing in the last week of May. There is a huge
amount at stake in on-going trade negotiations between the
US and EU which, if not successfully concluded by the 8
July deadline mutually agreed by the parties, could lead to
the imposition of tariffs as high as 50% for a large
proportion of bilateral EU-US goods trade.
Even more far-reaching and mutually destructive
restrictions could potentially be imposed on bilateral trade
in services. Given that total EU-US trade in goods and
services was valued at €1.6 trillion in 2023, the impact of a
breakdown in these on-going negotiations for the wider
global economy would be considerable.
Slow eurozone construction puts the brakes on wood
consumption
The weakness of the EU construction sector continues to
be a particularly significant drag on EU demand for all
timber products. Forward-looking indices show that EU
construction activity continues to decline. The HCOB
Eurozone Construction PMI Total Activity Index, a
seasonally adjusted index tracking monthly changes in
total industry activity, posted 44.8 in March and 46.0 in
April, both well below the boundary line (at 50) separating
growth from contraction.
The latest downturn extends the current sequence of
falling activity to 36 months. The only good news is that
the decline in April 2025 was the softest since February
2023. The slower decline largely reflected a softer
reduction in Germany, while the contraction in France
strengthened slightly. Meanwhile, activity in Italy broadly
stalled over the month.
Lower output was broad-based in nature across the three
monitored sectors covered by the report. Housing once
again posted the sharpest decline, though the latest
reduction was the softest in 26 months. Commercial and
civil engineering activity also saw softer contractions over
the month, though both remained solid overall.
Increase in EU27 tropical wooden furniture imports in
Q1 2025
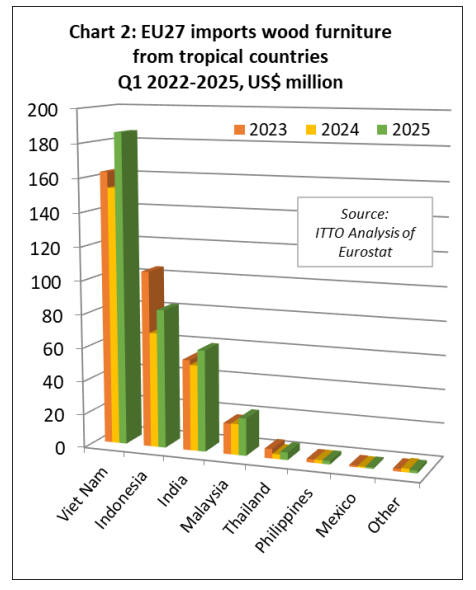
The EU27 imported 84,000 tonnes of wooden furniture
from tropical countries with a total value of USD361
million in the first quarter of 2025. Import quantity and
value were up 18% and 20% respectively compared to the
same period in 2024.
In the first quarter of 2025, EU27 import value of wooden
furniture increased from all major supply countries
including Vietnam (+21% to USD185.8 million),
Indonesia (+20% to USD82.8 million), India (+18% to
USD60.7 million), Malaysia (+20% to USD22.3 million),
Thailand (+59% to USD4.5 million), the Philippines (+2%
to USD2.1 million), and Mexico (+18% to USD0.9
million).
EU27 wooden furniture imports from all other tropical
countries were negligible during the quarter (Chart 2).
EU27 imports of tropical sawnwood just surpass last
year’s record low
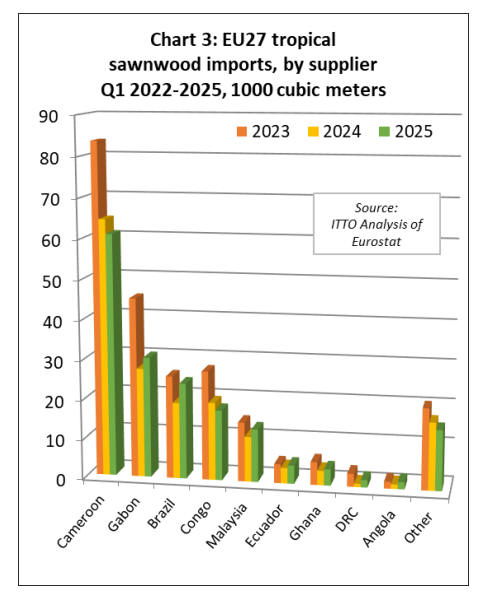
The EU27 imported 174,000 cu.m of tropical sawnwood
with a total value of USD158.3 million in the first quarter
of 2025, respectively 3% and 5% more than the same
period in 2024.
Tropical sawnwood imports were down in the first three
months of 2025 compared to the same period last year
from Cameroon (-6% to 60,900 cu.m), the Republic of
Congo (-10% to 17,700 cu.m), and Côte d'Ivoire (-43% to
1,400 cu.m).
However imports were up from all other major supply
countries including Gabon (+10% to 30,300 cu.m), Brazil
(+26% to 24,100 cu.m), Malaysia (+17% to 13,300 cu.m),
Ecuador (+19% to 4,600 cu.m), Ghana (+12% to 4,100
cu.m), the Democratic Republic of Congo (+126% to
1,900 cu.m), and Angola (+59% to 1,800 cu.m) (Chart 3).
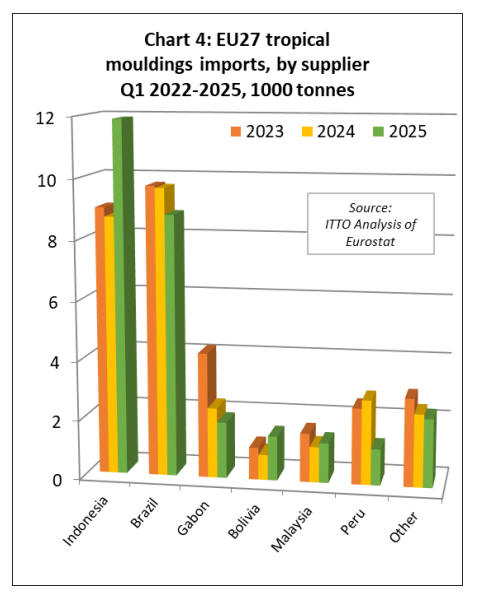
The EU27 imported 28,900 tonnes of tropical
mouldings/decking with a total value of USD51 million in
the first quarter of 2025, respectively 3% and 4% more
than the same period last year. The increase was driven by
a rise in imports from Indonesia (+37% to 11,900 tonnes),
Bolivia (+76% to 1,500 tonnes), and Malaysia (+13% to
1,300 tonnes). Imports declined from Brazil (-9% to 8,800
tonnes), Gabon (-203% to 1,900 tonnes), and Peru (-57%
to 1,200 tonnes) (Chart 4).
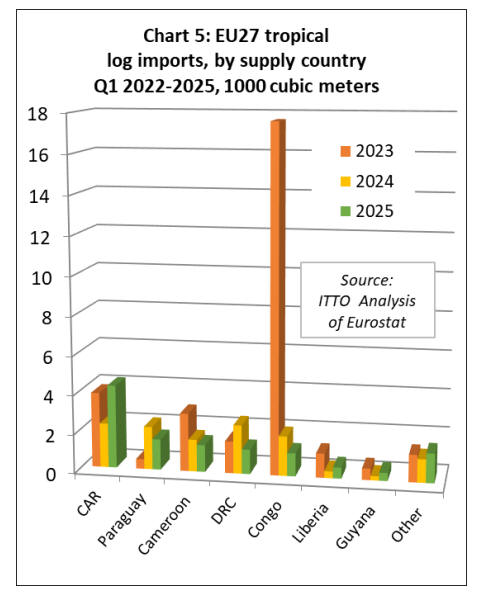
The EU27 imported 12,100 cu.m of tropical logs with a
total value of USD6.2 million in the first quarter of 2025,
respectively 2% and 14% less than the same period in
2024.
The decline in trade partly reflects progressively
tightening measures to curtail log exports from Central
Africa. In the first quarter of 2025, EU27 log imports fell
from Cameroon (-15% to 1,400 cu.m), the Democratic
Republic of Congo (-49% to 1,300 cu.m), and the
Republic of Congo (-42% to 1,200 cu.m).
Logs imports were also down from Paraguay, by 29% to
1,600 cu.m. However, these losses were partly offset by
increases from the Central African Republic (+88% to
4,300 cu.m), Liberia (+63% to 600 cu.m), and Guyana
(+88% to 400 cu.m) (Chart 5).
Slightly better start to the year for EU imports of
tropical panels and joinery products
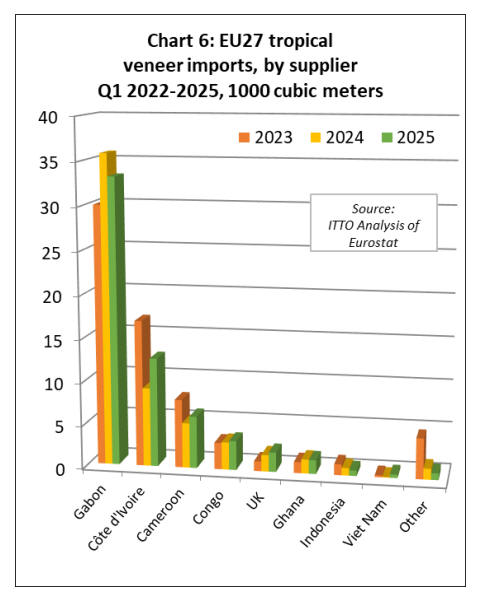
The EU27 imported 60,800 cu.m of tropical veneer with a
total value of USD40.9 million in the first quarter of 2025,
respectively up 3% and 1% compared to the same period
last year.
Imports of tropical veneer decreased 7% to 33,200 cu.m
from Gabon, the largest supplier, during the three month
period. They were also down from Ghana (-2% to 1,600
cu.m) and Indonesia (-28% to 600 cu.m) during the period.
However, EU27 imports increased in the first quarter of
2025 from Côte d'Ivoire (+39% to 12,600 cu.m),
Cameroon (+15% to 6,000 cu.m), the Republic of Congo
(+6% to 3,400 cu.m), the UK (+17% to 2,200 cu.m), and
Vietnam (+523% to 400 cu.m) (Chart 6).
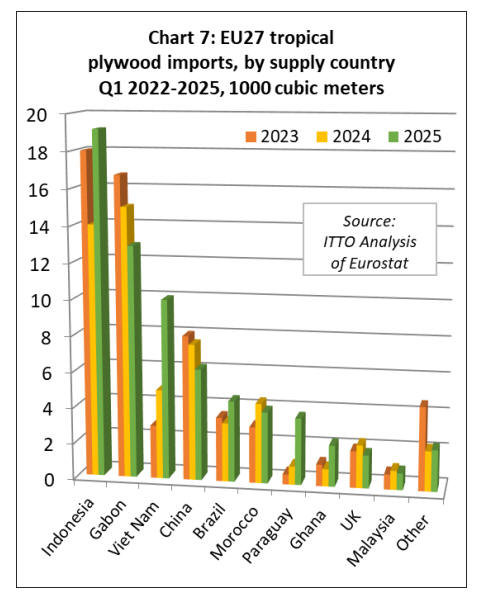
The EU27 imported 67,800 cu.m of tropical plywood with
a total value of USD47.4 million in the first quarter of
2025, up 19% and 11% respectively compared to the same
period in 2024. Imports increased during the three-month
period from Indonesia (+37% to 19,200 cu.m), Vietnam
(+101% to 10,000 cu.m), Brazil (+38% to 4,500 cu.m),
Paraguay (+267% to 3,700 cu.m), and Ghana (+139% to
2,300 cu.m).
However, these gains were partly offset in the first quarter
by declining imports from Gabon (-14% to 12,900 cu.m),
China (-18% to 6,200 cu.m), Morocco (-10% to 4,000
cu.m), the UK (-23% to 1,800 cu.m), and Malaysia (-12%
to 900 cu.m) (Chart 7).
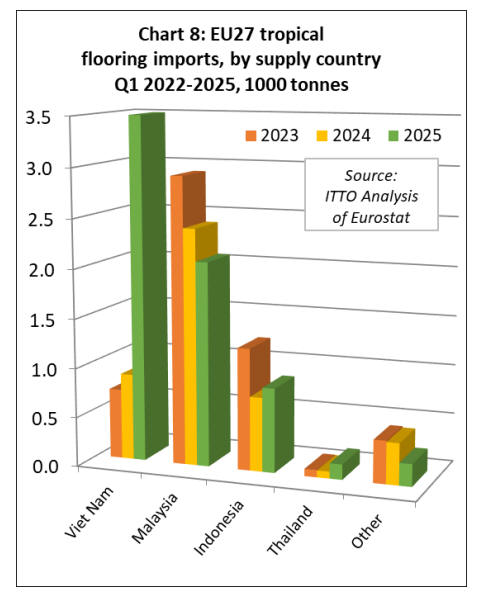
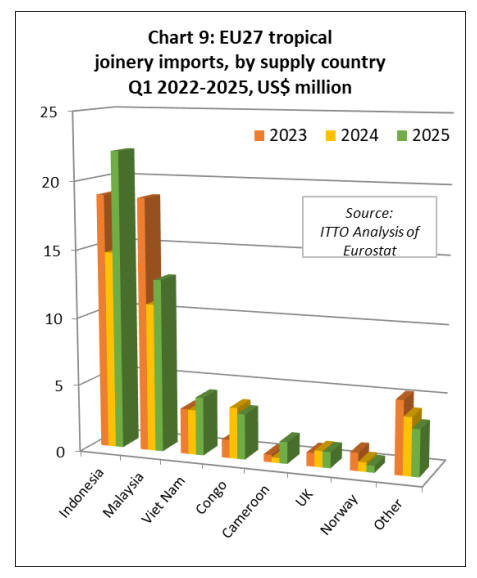
The EU27 imported 6,800 tonnes of tropical wood
flooring with a total value of USD15.5 million in the first
quarter of 2025, up 51% and 29% respectively compared
to the same period in 2024. Imports of 3,500 tonnes from
Vietnam in the first quarter this year were nearly 300%
more than the same period last year.
Imports also increased from Indonesia (+14% to 900
tonnes) and Thailand (+121% to 200 tonnes), but were
down from Malaysia (-14% to 2,100 tonnes) (Chart 9).
EU27 import value of other joinery products from tropical
countries - mainly laminated window scantlings, kitchen
tops and wood doors – was USD49.3 million in the first
quarter of 2025, 26% more than the same period last year.
Import quantity was up 31% to 21,800 tonnes in the same
period.
Import values increased from Indonesia (+51% to
USD22.1 million), Malaysia (+17% to USD12.8 million),
and Vietnam (+29% to USD4.3 million).
EU import value of laminated joinery products increased
from Cameroon in the first quarter this year, rising 324%
to USD1.6 million. However, imports from the Republic
of Congo began this year more slowly than last, being
down 11% at USD1.6 million. Indirect imports from the
UK also fell, by 2% to USD1.2 million (Chart 9).
EUDR updated guidance documents
On 15 April, the European Commission (EC) issued an
updated versions of the EUDR Frequently Asked
Questions (FAQ) and EUDR Guidance Document which
supersede the previous versions issued in October 2024.
The EC state that the main purpose of the latest guidance
is to provide “additional simplification measures”
including:
Allowing large companies to reuse existing due
diligence statements when goods, previously on
the EU market, are reimported.
Allowing an “authorised representative” to
submit a due diligence statement on behalf of
members of company group.
Allowing companies to submit due diligence
statements annually instead of for every shipment
or batch placed on the EU market.
Clarification of ‘ascertaining' that due diligence
has been carried out, so that large companies
downstream in the EU benefit from simplified
obligations.
The latest FAQ document and updated Guidance
document are available respectively at:
https://circabc.europa.eu/ui/group/34861680-e799-
4d7c-bbad-da83c45da458/library/e126f816-844b-
41a9-89ef-cb2a33b6aa56/details
https://environment.ec.europa.eu/document/5dc7aa19-
e58f-42a3-bbbe-f0eb2e5a1d3a_en
Results of EUDR country benchmarking released
On 22 May, the EU announced its classification of
countries into low, standard and high risk for purposes of
implementing EUDR ahead of its application at the end of
2025. According to the European Commission:
The benchmarking system classifies countries
according to the level of risk of producing
commodities covered by the scope of EUDR that
are not deforestation-free.
All countries have been assessed based on
quantitative criteria set out in Article 29(3) of the
EUDR and using the latest available data from
the Global Forest Resources Assessment dataset
of the Food and Agriculture Organization of the
United Nations (FAO FRA)
The benchmarking will facilitate EU operators'
due diligence processes and enable EU competent
authorities to effectively monitor and enforce
compliance. Additionally, it will incentivise
countries to improve the sustainability of their
agricultural production systems and minimise
their deforestation impact.
The risk classification defines the extent of
compliance checks that Member States’
competent authorities foresee among operators
sourcing from different countries (1% for ‘low
risk’, 3% for ‘standard risk’ and 9% for ‘high
risk’).
Sourcing from low-risk countries entails
simplified due diligence obligations for operators
and traders. This means that they need to collect
information for due diligence purposes but not
assess and mitigate risks.
The benchmarking process will be dynamic, with
a first review scheduled for 2026. This review is
intended to take account of the updated FAO
FRA data, expected to be published in October
2025.
The classification has been adopted through an
implementing act, accompanied by a Staff Working
Document outlining the benchmarking methodology. All
these documents, including the annex summarising the
risk rating of individual countries are available at:
See: https://environment.ec.europa.eu/publications/commission-
implementing-regulation-laying-down-rules-application-
deforestation-regulation_en
and
https://green-forum.ec.europa.eu/deforestation-regulation-
implementation/eudr-cooperation-and-partnerships/country-
classification-list_en
Selva Maya Tropical Timber Trade Mission 2024 – Final
report
In the early February ITTO Market Report the Selva Maya
mission was reported. The final report of the mission is
now available. The Selva Maya Tropical Timber Trade
Mission 2024 aimed to promote the international trade of
sustainably sourced tropical timber from forest
communities in the Selva Maya region spanning Petén,
Guatemala and the Yucatán Peninsula, Mexico, while
fostering strategic alliances and knowledge exchange
along the tropical timber value chain.
See:
https://docs.google.com/document/d/1cTqSJMtR6cJeC4fBh86d0
gFgF4q_toDfRcJnn_Zaw9Q/edit?tab=t.0
|