US Dollar Exchange Rates of
10th
March
2026
China Yuan 6.88
Report from China
2025 real estate and retail sales developments
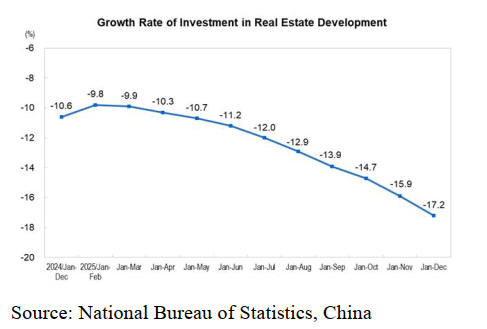
The National Bureau of Statistics (NBS) of China has
issued two press releases, one on the 2025 real estate
sector and the other on Retail Sales of Consumer Goods in
December 2025. The NBS says in 2025 investment in real
estate development decrease of 17.2%, of which
investment in residential buildings was down 16.3%.
In 2025 retail sales of convenience stores, supermarkets,
department stores and specialty stores among retail
enterprises increased by 5.5%, 4.3%, 0.1%, 2.6%
respectively year on year, those of brand-exclusive stores
declined by 0.6% year on year.
Online retail sales in 2025 were up by 8.6% year on year.
Specifically, online retail sales of physical goods were
higher by 5.2% and accounted for 26% of the total retail
sales of consumer goods.
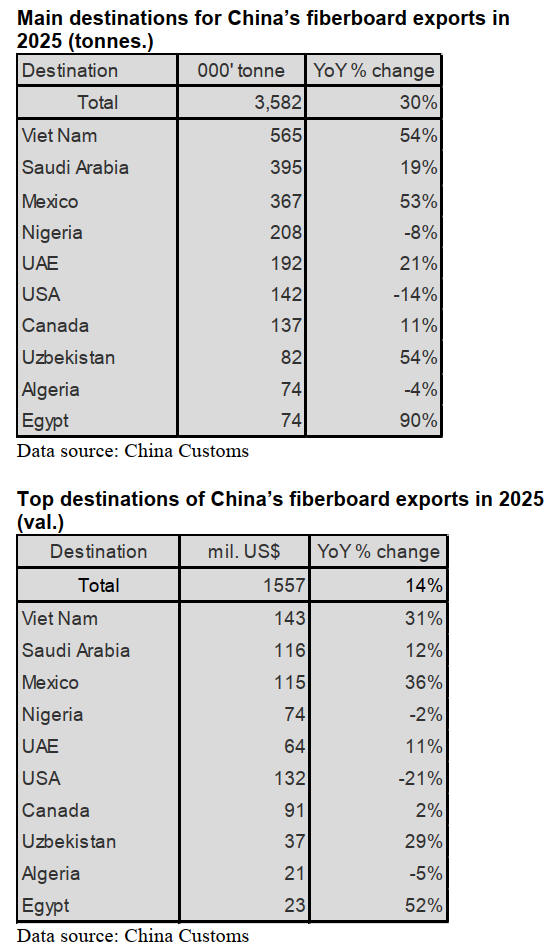
Growth in fibreboard exports
According to China Customs, China’s fibreboard exports
in 2025 grew 30% to 3.582 million tonnes valued at
US$1.557 billion, up 14% year on year.
China’s fibreboard exports to Viet Nam as the largest
destination in 2025 rose over 50% to 565,000 tonnes year
on year. Fibreboard exports to Saudi Arabia as second
largest destination in 2025 rose 19% to 395,000 tonnes
year on year.
In addition, China’s fibreboard exports to Mexico, UAE,
Canada, Uzbekistan and Egypt rose 53%, 21%, 11%, 54%
and 90% respectively compared to 2024 levels. In
contrast, China’s fibreboard exports to Nigeria, USA and
Algeria dropped 8%, 14% and 4% respectively on 2024.
The production capacity of fiberboard in China has been
continuously decreasing in recent years. Producers rely on
diversified international markets with domestic demand
accounting for only a fraction of the trade. China’s
fibreboard exports have experienced a significant increase
in 2025.
At the end of 2025 there were 220 fibreboard mills across
the country with a total of 244 production lines. The total
annual production capacity was 40.4 million cubic metres.
Compared with the situation at the end of 2024 capacity
decreased by 3%, representing a continuous decline for
four consecutive years.
Domestic demand has limited impact on China’s
fibreboard trade. Although the domestic home furnishing
industry is forecast at RMB15 trillion in 2025 the demand
for fibreboard is driven by urbanisation and environmental
protection policies. However, the real estate market has
not shown a significant recovery and the transmission
effect of domestic demand on fibreboard exports is
relatively weak.
The growth of China's fiberboard exports mainly relies on
diversification in emerging markets rather than a single
market boom. By 2025, China's fiberboard exports have
faced structural pressures such as trade friction, capacity
contraction and rising costs. Despite these challenges,
China’s fibreboard exports maintained a relatively stable
growth in 2025.
Rise in fibreboard imports
According to China Customs, China’s fiberboard imports
rose 12% to 60, 000 tonnes valued at US$44 million in
2025, down 6% year on year. New Zealand was the largest
suppliers in 2025. China’s fibreboard imports from New
Zealand rose 68% to 28,000 tonnes on 2024 levels and
accounted for 47% of national imports.
The main reasons for the significant increase in China's
imports of New Zealand fiberboard is that the quality of
New Zealand radiata pine fibreboard is stable and the
maritime transportation route is mature with a high level
of supply chain reliability.
The upgraded China-New Zealand Free Trade Agreement
will gradually eliminate tariffs on 12 categories of wood
and paper products (including wood fibreboard) over a
period of 10 years significantly enhancing the price
competitiveness of New Zealand's fibreboards in the
Chinese market.
75% of China’s fibreboard was imported from 4 countries
in 2025, namely New Zealand, Thailand, Germany and
Romania.
China’s fibreboard imports from Romania in 2025 grew
8% to 5,100 tonnes year on year. In contrast, China’s
fibreboard imports from Thailand and Germany in 2025
dropped 35% and 22% respectively on 2024 level. It is
worth noting that China’s fiberboard imports from
Australia and Malaysia in 2025 surged over 160% and
nearly 500% respectively year on year.
In contrast, China’s fiberboard imports from Belgium and
Switzerland in 2025 fell 27% and 28% respectively on
2024 level.

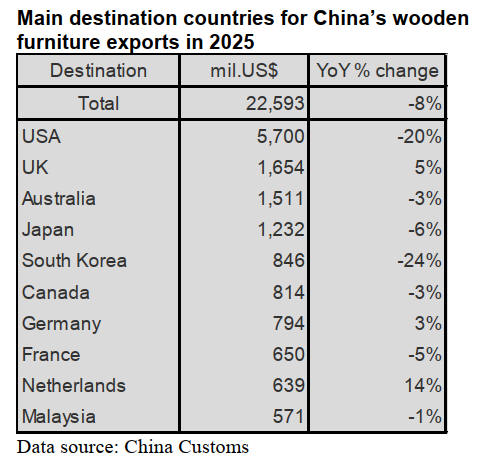
Decline in wooden furniture exports
China Customs data shows the value of China's wooden
furniture exports in 2025 dropped 8% to US$22.593
billion year on year. The USA was is the largest market
for China’s wooden furniture exports with around 25% of
China’s wooden furniture being shipped to the US valued
at US$5.7 bil. in 2025, down 20% on 2024.
The decline in China's furniture exports in 2025 was
mainly attributed to the trade friction between China and
the United States.
China’s wooden furniture was exported to more than 200
countries in 2025. The value of China’s furniture exports
to the top 4 countries the USA, UK, Australia and Japan
with furniture exports of more than US$1 billion,
accounted for 45% of the national total in 2025.
The value of China’s wooden furniture exports to UK and
Netherlands in 2025 rose 5% and 14% respectively year
on year. In contrast, the value of China’s wooden furniture
exports to the rest of the top destination countries in 2025
dropped at different rates on 2024 level.
Decline in wooden furniture imports
The value of China’s wooden furniture imports in 2025
fell 7% to US$609 million year on year. Italy, Germany
and Viet Nam were the top three suppliers. 67% of
China’s wooden furniture were imported from those 3
countries but imports fell 7%, 19% and 23% respectively
in 2025. This is the main reason for the decrease in the
overall value of China’s wooden furniture imports in 2025.

The main reason for the large decline in China's furniture
imports is that domestic demand for furniture has fallen
sharply due to the downturn in China's real estate market.
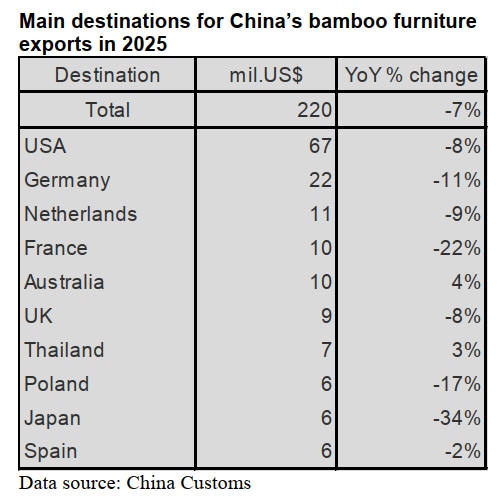
Decline in Bamboo furniture exports
The value of China’s bamboo exports in 2025 dropped 7%
to US$220 million year on year. The value of bamboo
furniture exports to the USA, as the largest destination, fell
8% year on year and accounted for 31% of the national
total furniture export value in 2025.
Also, the value of China’s bamboo furniture exports to
Germany, France, Poland and Japan dropped 11%, 22%,
17% and 34% respectively year on year. In contrast,
China’s bamboo furniture exports to Australia and
Thailand rose 4% and 3% year on year.
The main reasons for the decrease in the value of Chinese
bamboo furniture exports were as follows:
The United States has continuously imposed tariffs
on Chinese wood products, especially placing
significant pressure on traditional categories such as
wooden and bamboo furniture.
Many countries have initiated anti-dumping
investigations and implemented technical trade
barriers (such as environmental standards and wood
legality certifications) against Chinese furniture,
increasing the compliance costs for enterprise
exports.
Major consumer markets such as Europe and the
United States are affected by high inflation and high
interest rates, resulting in weakened consumer
willingness to buy home furnishings, thereby putting
pressure on the export of non-essential products like
bamboo furniture.
Although the dependence on the United States has
been decreasing year by year, the United States
remains the largest buyer and the high market
concentration brings risks.
Some bamboo furniture enterprises still mainly
engage in OEM (Original Equipment Manufacturing)
with low proportions of their own brands and high
value-added products, making it difficult for them to
respond to changes in high-end market demands.
Decline in bamboo furniture imports
According to China Customs, the value of China’s
bamboo furniture imports in 2025 fell 26% to US$1.739
billion year on year.
Indonesia was the largest supplier of China’s bamboo
furniture imports in 2025 but imports from Indonesia in
2025 fell 18% on 2024 levels and this directly resulted in
the overall decline in imports.
87% of China’s bamboo furniture were imported from
Indonesia, Viet Nam and Italy in 2025 but declined 18%,
14% and 5% respectively year on year.

|