| Home: Global Wood |
|
Industry News & Markets |
|
U.S. Construction materials
prices up fractionally in July |
 The producer price index (PPI) report from the Bureau of Labor Statistics (BLS) stated that construction materials prices were up 0.1 percent month-over-month in July on a seasonally adjusted basis. However, the change in construction materials prices for June was revised to a 0.2 percent decline from the last month’s report of a 0.1 percent increase. The index of components and materials for construction was up 1.4 percent from its year-earlier level. Overall prices for processed goods for intermediate demand were up 0.7 percent for the month. The volatile prices of processed fuels and lubricants rose 2.8 percent. The overall processed goods for intermediate demand index was 0.8 percent higher than its year-earlier level. For reference, the changes in these indices compare with a 3.0 percent rise in the all-items consumer price index (CPI-U) for the 12 months ending in June. The July CPI will be released August 14. Yield Pro compiled the BLS reported changes for our standard list of construction materials prices. These are prices of materials which directly impact the cost of constructing an apartment building. The first two right hand columns of the table provide the percent change in the price of the commodity from a year earlier (12 Mo PC Change) and the percent change in price from June (1 Mo PC Change). If no price data is available for a given commodity, the change is listed as N/A. The pre-COVID column lists the change in the current construction materials prices relative to the average of prices from December 2019 through February 2020, before the pandemic impacted the economy. This provides a longer-term view of construction materials price trends. 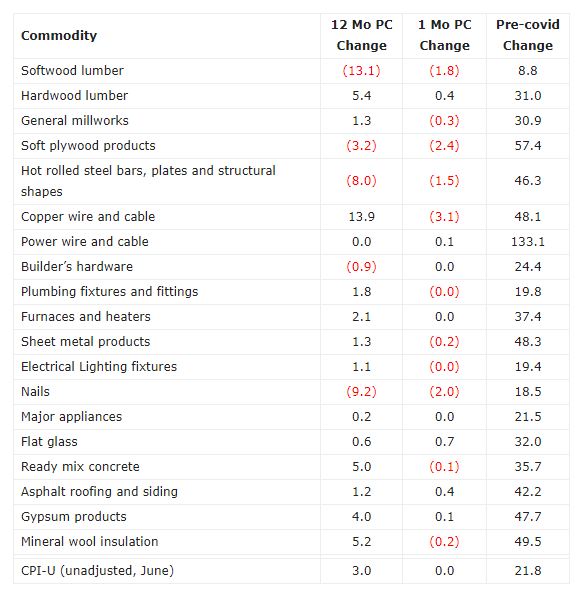 The prices used by the BLS in compiling the indexes are collected on the Tuesday of the week containing the 13th day of the month. In July that would have been July 9. In the August report, the data collection date will be August 13. The first chart, below, shows the price index history for wood products over the past 37 months. 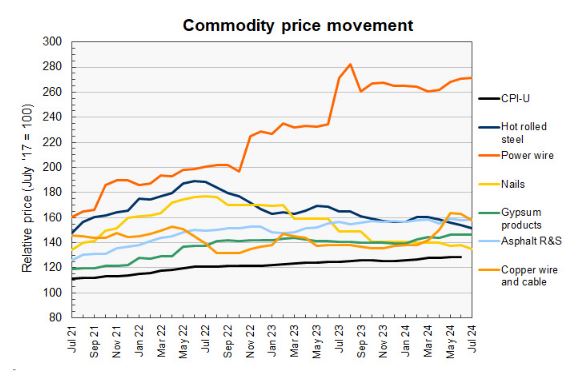 The price indexes for the two most important categories of wood products, softwood lumber and soft plywood products, have been falling lately. Both indexes are down month-over-month and year-over-year and are now less than half of their all-time highs. The price index for softwood lumber has actually risen by less that the CPI since our reference date of July 2017. This is also true for the price index for hardwood lumber, although that index has been rising lately. The next chart, below, shows the recent history of several other construction materials prices. These are relatively simple commodities whose prices are strongly driven by those of the materials of which they are comprised. The price index for copper wire fell this month, aided by upward revisions to its values for the last three months. While up substantially from its price range in 2023, it is down nearly 4 percent from the multi-year high it reached in May. Its recent decline has its price now approaching the range it occupied in 2021. Last month’s price index for power wire and cable rose only fractionally this month. It remains the most elevated relative to its pre-pandemic level of the prices we track. Prices for nails and for hot-rolled steel bars have fallen significantly from their highs. However, prices for other steel products, such as builder’s hardware and sheet metal products (not charted) are near their multi-year highs. Price changes for several of the more finished goods from our sample are illustrated in the final chart, below. 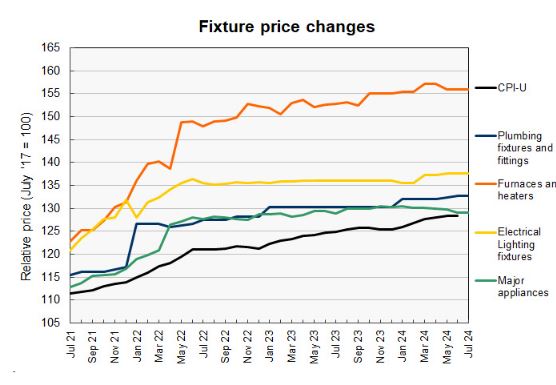 After rising significantly in 2022 into early 2023, the price indexes for these goods have been almost unbelievably stable since then. They often follow a pattern where they may be nearly unchanged for extended periods of time before rising in stair-step fashion. While the price index for major appliances was reported to be effectively unchanged, last month’s price index was revised higher by 1.4 percent. While the price index for electrical lighting fixtures was reported to be effectively unchanged, last month’s price index was revised higher by 1.3 percent. Last month’s price indexes for plumbing fixtures and fittings (+0.22 percent) and furnaces and heaters (+0.11 percent) were also revised higher while their price indexes were reported to be nearly unchanged in July. Source: yieldpro.com |