| Home: Global Wood |
|
Industry News & Markets |
|
U.S. New-Home Sales Rise Amid
Falling Prices: A Mixed Bag For Builders |
Zonda’s New Home Market Update report for August reveals a 1.2% increase in sales as rates drop. While home builders weren’t overly enthusiastic about sales last month, total transactions weren’t bad, according to Zonda’s New Home Market Update report for August. 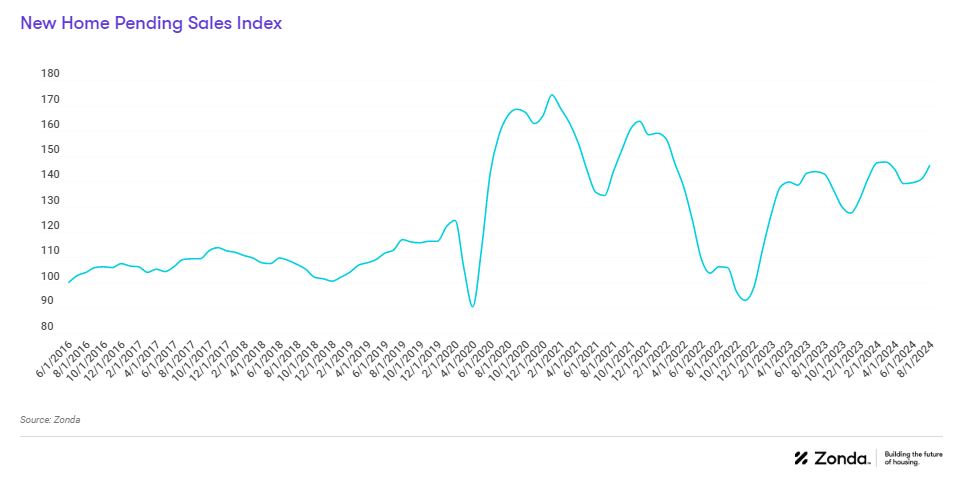 Zonda’s new-home sales metric rose both month over month and year over year. In addition, the Zonda Market Ranking, a measure of home sales adjusting the data for supply and seasonality, improved month over month in select markets. “The hope is that lower interest rates will help pull more consumers off the sidelines in two main ways,” says Ali Wolf, chief economist with Zonda. “For a more cost-sensitive, entry-level buyer, lower interest rates can help ease the burden of the monthly mortgage payment. An existing homeowner, on the other hand, may feel more inclined to move up or move down as the gap between their current interest rate and market interest rates narrow.” Accounting for both cancellations and seasonality, Zonda's new-home sales metric shows there were 720,627 new homes sold in August on a seasonally adjusted annualized rate. This was a gain of 1.2% from last month and an increase of 0.7% from a year ago. On a non-seasonally adjusted basis, 60,032 homes were sold, 2% higher than last year and 10.5% above the same month in 2019. Zonda's New Home Pending Sales Index (PSI) came in at 146.3, representing a 2.3% rise from the same month last year. On a month-over-month basis, seasonally adjusted new-home sales increased 4%. The index is currently 16% below cycle highs. Markets that posted the best numbers relative to last year were Sacramento (+9.6%), San Antonio (+6.6%), and Minneapolis (+6.3%). Sales were down year over year in 15 of the select markets, led by Salt Lake City, Los Angeles/OC, and Atlanta. On a monthly basis, San Francisco, Sacramento, and Riverside/San Bernardino were the best performing markets, with San Francisco increasing 22% relative to last month. To add further context on the metro level, the Zonda Market Ranking (ZMR) was created. The national ZMR came in at 117.6 in August, indicating a slightly overperforming market, ranking in line with last month and this time last year. Zonda’s snapshot markets were split between 50% overperforming, 30% average, and 20% underperforming in August. Among Zonda’s top 50 major markets, 64% were overperforming, 20% were average, and 16% were underperforming. 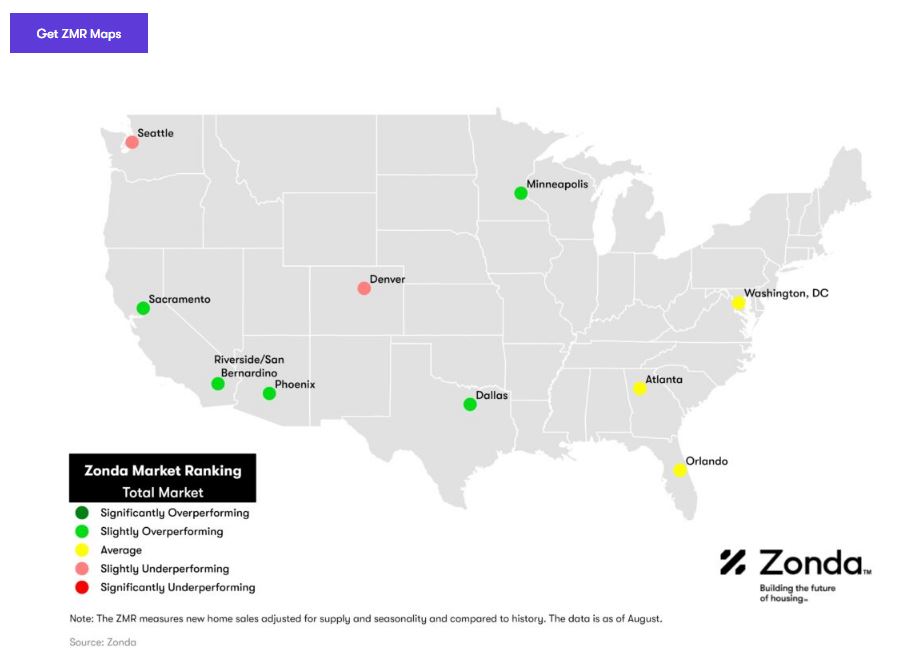 According to Zonda, national home prices decreased year over year across entry-level, move-up, and high-end homes. Prices fell 3.1% for entry-level to $329,307, 2.2% for move-up to $517,938, and 0.3% for high-end homes to $911,064. Supplementing with a monthly builder survey data,15% of builders lowered prices in August, 65% held prices flat, and 20% raised prices. In July, for comparison, 18% of builders lowered prices month over month, 66% held prices flat, and 16% increased prices. Incentives are still common in today’s housing market. Fifty-eight percent of new-home communities offered incentives in August, the same percentage as last month. Zonda’s builder survey captured that the majority of builders are offering mortgage rate buydowns, with 50% of builders reporting they are willing and able to offer a buydown between the low-4%s and the low-5%s. Currently, there are 14,793 actively selling communities tracked by Zonda, up 3.7% from last year. On a month-over-month basis, the national figure slipped 2.2%. Total community count is 23% below the same month in 2019. Dallas (+14.8%), Baltimore (+9.6%), and Atlanta (+9.3%) grew community count the most year over year. Relative to last year, the biggest community count declines were in San Francisco (-20.8%), Los Angeles/OC (-18.9%), and Riverside/San Bernardino (-14.4%). National quick move-ins (QMIs), or homes that can be occupied within 90 days, totaled 30,578, up 7.7% compared to last year but 6.6% lower month over month. Total QMIs are 32.3% above 2019 levels. On a metro basis, 48% of Zonda's select markets increased QMI count year over year. The markets that grew the most year over year were Philadelphia (+67.3%), Charlotte (+42.9%), and Orlando (+35.2%). Las Vegas, Cincinnati, and Salt Lake City have seen the most growth in QMIs compared to the same time in 2019, up 187.1%, 182.2%, and 170.9%, respectively. Source: builderonline.com |